

Legendary fund manager Li Lu (who Charlie Munger backed) once said, 'The biggest investment risk is not the volatility of prices, but whether you will suffer a permanent loss of capital.' So it might be obvious that you need to consider debt, when you think about how risky any given stock is, because too much debt can sink a company. We note that AB Builders Group Limited (HKG:1615) does have debt on its balance sheet. But the real question is whether this debt is making the company risky.
When Is Debt A Problem?
Generally speaking, debt only becomes a real problem when a company can't easily pay it off, either by raising capital or with its own cash flow. If things get really bad, the lenders can take control of the business. However, a more frequent (but still costly) occurrence is where a company must issue shares at bargain-basement prices, permanently diluting shareholders, just to shore up its balance sheet. Having said that, the most common situation is where a company manages its debt reasonably well - and to its own advantage. When we examine debt levels, we first consider both cash and debt levels, together.
Check out our latest analysis for AB Builders Group
How Much Debt Does AB Builders Group Carry?
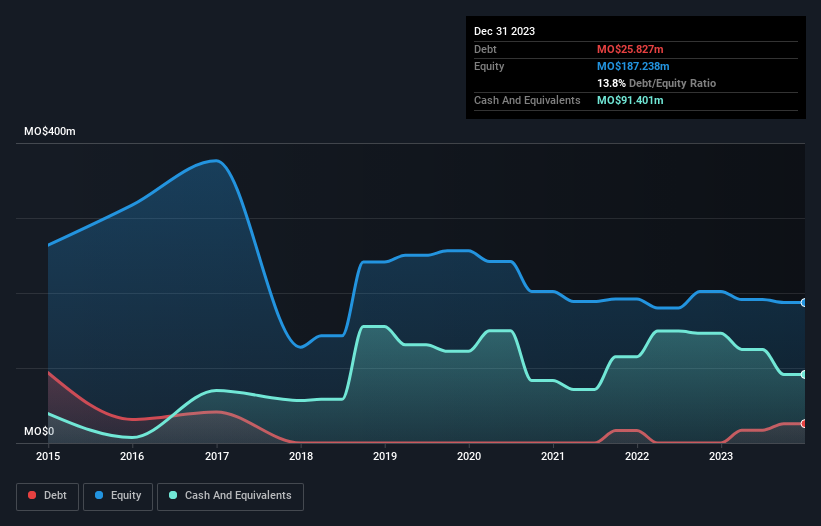
As you can see below, at the end of December 2023, AB Builders Group had MO$25.8m of debt, up from none a year ago. Click the image for more detail. However, its balance sheet shows it holds MO$91.4m in cash, so it actually has MO$65.6m net cash.
A Look At AB Builders Group's Liabilities
The latest balance sheet data shows that AB Builders Group had liabilities of MO$125.2m due within a year, and liabilities of MO$849.0k falling due after that. Offsetting these obligations, it had cash of MO$91.4m as well as receivables valued at MO$60.0m due within 12 months. So it actually has MO$25.4m more liquid assets than total liabilities.
This surplus suggests that AB Builders Group is using debt in a way that is appears to be both safe and conservative. Because it has plenty of assets, it is unlikely to have trouble with its lenders. Simply put, the fact that AB Builders Group has more cash than debt is arguably a good indication that it can manage its debt safely. When analysing debt levels, the balance sheet is the obvious place to start. But it is AB Builders Group's earnings that will influence how the balance sheet holds up in the future. So when considering debt, it's definitely worth looking at the earnings trend. Click here for an interactive snapshot.
Over 12 months, AB Builders Group made a loss at the EBIT level, and saw its revenue drop to MO$141m, which is a fall of 9.3%. That's not what we would hope to see.
So How Risky Is AB Builders Group?
We have no doubt that loss making companies are, in general, riskier than profitable ones. And in the last year AB Builders Group had an earnings before interest and tax (EBIT) loss, truth be told. And over the same period it saw negative free cash outflow of MO$37m and booked a MO$10m accounting loss. With only MO$65.6m on the balance sheet, it would appear that its going to need to raise capital again soon. Even though its balance sheet seems sufficiently liquid, debt always makes us a little nervous if a company doesn't produce free cash flow regularly. There's no doubt that we learn most about debt from the balance sheet. But ultimately, every company can contain risks that exist outside of the balance sheet. For example, we've discovered 2 warning signs for AB Builders Group (1 can't be ignored!) that you should be aware of before investing here.
At the end of the day, it's often better to focus on companies that are free from net debt. You can access our special list of such companies (all with a track record of profit growth). It's free.
New: Manage All Your Stock Portfolios in One Place
We've created the ultimate portfolio companion for stock investors, and it's free.
• Connect an unlimited number of Portfolios and see your total in one currency
• Be alerted to new Warning Signs or Risks via email or mobile
• Track the Fair Value of your stocks
Have feedback on this article? Concerned about the content? Get in touch with us directly. Alternatively, email editorial-team (at) simplywallst.com.
This article by Simply Wall St is general in nature. We provide commentary based on historical data and analyst forecasts only using an unbiased methodology and our articles are not intended to be financial advice. It does not constitute a recommendation to buy or sell any stock, and does not take account of your objectives, or your financial situation. We aim to bring you long-term focused analysis driven by fundamental data. Note that our analysis may not factor in the latest price-sensitive company announcements or qualitative material. Simply Wall St has no position in any stocks mentioned.
Have feedback on this article? Concerned about the content? Get in touch with us directly. Alternatively, email editorial-team@simplywallst.com
About SEHK:1615
AB Builders Group
An investment holding company, engages in the provision of construction services in Macau, the People’s Republic of China, and Hong Kong.
Mediocre balance sheet with questionable track record.
Market Insights

Community Narratives

