- Hong Kong
- /
- Construction
- /
- SEHK:1546
Thelloy Development Group Limited's (HKG:1546) Shares Climb 31% But Its Business Is Yet to Catch Up


Thelloy Development Group Limited (HKG:1546) shares have continued their recent momentum with a 31% gain in the last month alone. Looking further back, the 13% rise over the last twelve months isn't too bad notwithstanding the strength over the last 30 days.
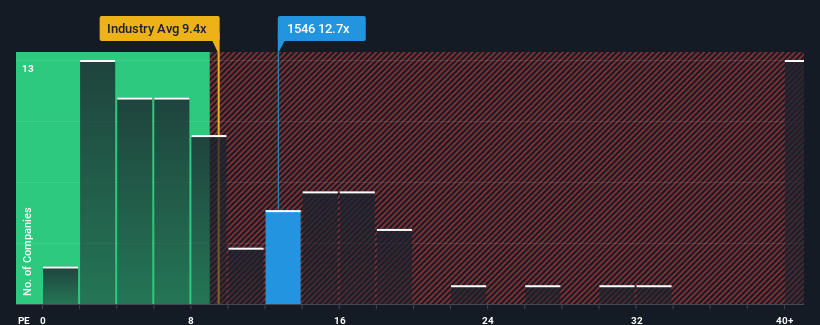
Following the firm bounce in price, given around half the companies in Hong Kong have price-to-earnings ratios (or "P/E's") below 9x, you may consider Thelloy Development Group as a stock to potentially avoid with its 12.7x P/E ratio. Although, it's not wise to just take the P/E at face value as there may be an explanation why it's as high as it is.
For instance, Thelloy Development Group's receding earnings in recent times would have to be some food for thought. One possibility is that the P/E is high because investors think the company will still do enough to outperform the broader market in the near future. You'd really hope so, otherwise you're paying a pretty hefty price for no particular reason.
Check out our latest analysis for Thelloy Development Group
How Is Thelloy Development Group's Growth Trending?
The only time you'd be truly comfortable seeing a P/E as high as Thelloy Development Group's is when the company's growth is on track to outshine the market.
Taking a look back first, the company's earnings per share growth last year wasn't something to get excited about as it posted a disappointing decline of 35%. As a result, earnings from three years ago have also fallen 61% overall. So unfortunately, we have to acknowledge that the company has not done a great job of growing earnings over that time.
Comparing that to the market, which is predicted to deliver 22% growth in the next 12 months, the company's downward momentum based on recent medium-term earnings results is a sobering picture.
In light of this, it's alarming that Thelloy Development Group's P/E sits above the majority of other companies. It seems most investors are ignoring the recent poor growth rate and are hoping for a turnaround in the company's business prospects. There's a very good chance existing shareholders are setting themselves up for future disappointment if the P/E falls to levels more in line with the recent negative growth rates.
The Final Word
Thelloy Development Group's P/E is getting right up there since its shares have risen strongly. Generally, our preference is to limit the use of the price-to-earnings ratio to establishing what the market thinks about the overall health of a company.
We've established that Thelloy Development Group currently trades on a much higher than expected P/E since its recent earnings have been in decline over the medium-term. When we see earnings heading backwards and underperforming the market forecasts, we suspect the share price is at risk of declining, sending the high P/E lower. If recent medium-term earnings trends continue, it will place shareholders' investments at significant risk and potential investors in danger of paying an excessive premium.
And what about other risks? Every company has them, and we've spotted 4 warning signs for Thelloy Development Group (of which 1 doesn't sit too well with us!) you should know about.
Of course, you might also be able to find a better stock than Thelloy Development Group. So you may wish to see this free collection of other companies that have reasonable P/E ratios and have grown earnings strongly.
Valuation is complex, but we're here to simplify it.
Discover if Thelloy Development Group might be undervalued or overvalued with our detailed analysis, featuring fair value estimates, potential risks, dividends, insider trades, and its financial condition.
Access Free AnalysisHave feedback on this article? Concerned about the content? Get in touch with us directly. Alternatively, email editorial-team (at) simplywallst.com.
This article by Simply Wall St is general in nature. We provide commentary based on historical data and analyst forecasts only using an unbiased methodology and our articles are not intended to be financial advice. It does not constitute a recommendation to buy or sell any stock, and does not take account of your objectives, or your financial situation. We aim to bring you long-term focused analysis driven by fundamental data. Note that our analysis may not factor in the latest price-sensitive company announcements or qualitative material. Simply Wall St has no position in any stocks mentioned.
About SEHK:1546
Thelloy Development Group
An investment holding company, provides property construction services primarily in Hong Kong.
Slight and slightly overvalued.
Market Insights

Community Narratives

