
Advertisement
- Hong Kong
- /
- Construction
- /
- SEHK:1546
Thelloy Development Group (HKG:1546) Will Want To Turn Around Its Return Trends
What trends should we look for it we want to identify stocks that can multiply in value over the long term? Firstly, we'll want to see a proven return on capital employed (ROCE) that is increasing, and secondly, an expanding base of capital employed. Basically this means that a company has profitable initiatives that it can continue to reinvest in, which is a trait of a compounding machine. However, after briefly looking over the numbers, we don't think Thelloy Development Group (HKG:1546) has the makings of a multi-bagger going forward, but let's have a look at why that may be.
What Is Return On Capital Employed (ROCE)?
Just to clarify if you're unsure, ROCE is a metric for evaluating how much pre-tax income (in percentage terms) a company earns on the capital invested in its business. To calculate this metric for Thelloy Development Group, this is the formula:
Return on Capital Employed = Earnings Before Interest and Tax (EBIT) ÷ (Total Assets - Current Liabilities)
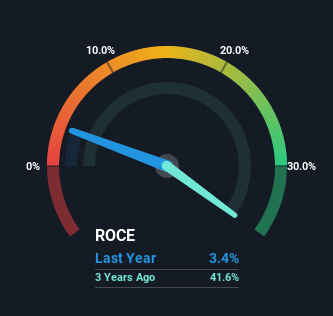
0.034 = HK$5.2m ÷ (HK$272m - HK$119m) (Based on the trailing twelve months to March 2022).
So, Thelloy Development Group has an ROCE of 3.4%. In absolute terms, that's a low return and it also under-performs the Construction industry average of 7.1%.
See our latest analysis for Thelloy Development Group
While the past is not representative of the future, it can be helpful to know how a company has performed historically, which is why we have this chart above. If you'd like to look at how Thelloy Development Group has performed in the past in other metrics, you can view this free graph of past earnings, revenue and cash flow.
What The Trend Of ROCE Can Tell Us
In terms of Thelloy Development Group's historical ROCE movements, the trend isn't fantastic. Around five years ago the returns on capital were 31%, but since then they've fallen to 3.4%. However, given capital employed and revenue have both increased it appears that the business is currently pursuing growth, at the consequence of short term returns. If these investments prove successful, this can bode very well for long term stock performance.
On a side note, Thelloy Development Group has done well to pay down its current liabilities to 44% of total assets. That could partly explain why the ROCE has dropped. Effectively this means their suppliers or short-term creditors are funding less of the business, which reduces some elements of risk. Some would claim this reduces the business' efficiency at generating ROCE since it is now funding more of the operations with its own money. Keep in mind 44% is still pretty high, so those risks are still somewhat prevalent.
The Bottom Line
In summary, despite lower returns in the short term, we're encouraged to see that Thelloy Development Group is reinvesting for growth and has higher sales as a result. And there could be an opportunity here if other metrics look good too, because the stock has declined 55% in the last five years. So we think it'd be worthwhile to look further into this stock given the trends look encouraging.
If you'd like to know more about Thelloy Development Group, we've spotted 4 warning signs, and 2 of them are a bit unpleasant.
While Thelloy Development Group isn't earning the highest return, check out this free list of companies that are earning high returns on equity with solid balance sheets.
Valuation is complex, but we're here to simplify it.
Discover if Thelloy Development Group might be undervalued or overvalued with our detailed analysis, featuring fair value estimates, potential risks, dividends, insider trades, and its financial condition.
Access Free AnalysisHave feedback on this article? Concerned about the content? Get in touch with us directly. Alternatively, email editorial-team (at) simplywallst.com.
This article by Simply Wall St is general in nature. We provide commentary based on historical data and analyst forecasts only using an unbiased methodology and our articles are not intended to be financial advice. It does not constitute a recommendation to buy or sell any stock, and does not take account of your objectives, or your financial situation. We aim to bring you long-term focused analysis driven by fundamental data. Note that our analysis may not factor in the latest price-sensitive company announcements or qualitative material. Simply Wall St has no position in any stocks mentioned.
About SEHK:1546
Thelloy Development Group
An investment holding company, provides property construction services primarily in Hong Kong.
Slight risk and overvalued.
Market Insights

Advertisement
Community Narratives
100% Patient Improvement in trial puts this $16M Biotech on the radar
Fair Value US$5.30|69.8% undervalued
JO
Community Contributor
Exxon Mobil's 17.5% Upside Promises Industry-Leading Returns in Energy Transition
Fair Value US$132.00|15.0% undervalued
HE
Community Contributor
NHC Analysis: Quality at a Good Price. A Golden Opportunity?
Fair Value US$179.80|35.9% undervalued
DA
Community Contributor
Product Refresh And Global Expansion Will Empower Future Market Leadership
Fair Value US$202.60|0% overvalued
AN
Based on Analyst Price Targets