
Advertisement
- Hong Kong
- /
- Construction
- /
- SEHK:1546
Thelloy Development Group (HKG:1546) May Have Issues Allocating Its Capital
What underlying fundamental trends can indicate that a company might be in decline? Typically, we'll see the trend of both return on capital employed (ROCE) declining and this usually coincides with a decreasing amount of capital employed. This indicates the company is producing less profit from its investments and its total assets are decreasing. So after we looked into Thelloy Development Group (HKG:1546), the trends above didn't look too great.
Understanding Return On Capital Employed (ROCE)
If you haven't worked with ROCE before, it measures the 'return' (pre-tax profit) a company generates from capital employed in its business. The formula for this calculation on Thelloy Development Group is:
Return on Capital Employed = Earnings Before Interest and Tax (EBIT) ÷ (Total Assets - Current Liabilities)
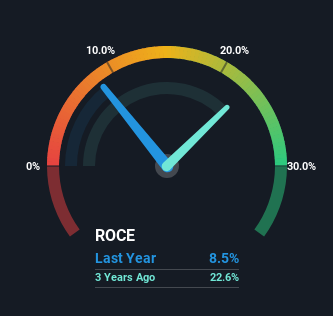
0.085 = HK$14m ÷ (HK$341m - HK$177m) (Based on the trailing twelve months to March 2023).
Thus, Thelloy Development Group has an ROCE of 8.5%. In absolute terms, that's a low return, but it's much better than the Construction industry average of 6.1%.
Check out our latest analysis for Thelloy Development Group
While the past is not representative of the future, it can be helpful to know how a company has performed historically, which is why we have this chart above. If you want to delve into the historical earnings, revenue and cash flow of Thelloy Development Group, check out these free graphs here.
What The Trend Of ROCE Can Tell Us
There is reason to be cautious about Thelloy Development Group, given the returns are trending downwards. Unfortunately the returns on capital have diminished from the 52% that they were earning five years ago. Meanwhile, capital employed in the business has stayed roughly the flat over the period. Companies that exhibit these attributes tend to not be shrinking, but they can be mature and facing pressure on their margins from competition. So because these trends aren't typically conducive to creating a multi-bagger, we wouldn't hold our breath on Thelloy Development Group becoming one if things continue as they have.
On a related note, Thelloy Development Group has decreased its current liabilities to 52% of total assets. So we could link some of this to the decrease in ROCE. Effectively this means their suppliers or short-term creditors are funding less of the business, which reduces some elements of risk. Some would claim this reduces the business' efficiency at generating ROCE since it is now funding more of the operations with its own money. Keep in mind 52% is still pretty high, so those risks are still somewhat prevalent.
The Key Takeaway
In summary, it's unfortunate that Thelloy Development Group is generating lower returns from the same amount of capital. Unsurprisingly then, the stock has dived 81% over the last five years, so investors are recognizing these changes and don't like the company's prospects. Unless there is a shift to a more positive trajectory in these metrics, we would look elsewhere.
Thelloy Development Group does come with some risks though, we found 3 warning signs in our investment analysis, and 2 of those don't sit too well with us...
While Thelloy Development Group isn't earning the highest return, check out this free list of companies that are earning high returns on equity with solid balance sheets.
Valuation is complex, but we're here to simplify it.
Discover if Thelloy Development Group might be undervalued or overvalued with our detailed analysis, featuring fair value estimates, potential risks, dividends, insider trades, and its financial condition.
Access Free AnalysisHave feedback on this article? Concerned about the content? Get in touch with us directly. Alternatively, email editorial-team (at) simplywallst.com.
This article by Simply Wall St is general in nature. We provide commentary based on historical data and analyst forecasts only using an unbiased methodology and our articles are not intended to be financial advice. It does not constitute a recommendation to buy or sell any stock, and does not take account of your objectives, or your financial situation. We aim to bring you long-term focused analysis driven by fundamental data. Note that our analysis may not factor in the latest price-sensitive company announcements or qualitative material. Simply Wall St has no position in any stocks mentioned.
About SEHK:1546
Thelloy Development Group
An investment holding company, provides property construction services primarily in Hong Kong.
Low risk and slightly overvalued.
Market Insights

Advertisement
Community Narratives
Kodiak AI - a potential 100 bagger opportunity?
Fair Value US$14.00|44.7% undervalued
DA
Community Contributor
A Fair Price for a Great Business Facing Real Threats
Fair Value US$383.06|13.0% undervalued
IM
Community Contributor
AXON And Shopify Integration Will Unlock Global Mobile Advertising
Fair Value US$646.30|0% overvalued
AN
Based on Analyst Price Targets