
Advertisement
- Hong Kong
- /
- Construction
- /
- SEHK:1429
Skymission Group Holdings Limited's (HKG:1429) 70% Price Boost Is Out Of Tune With Revenues

Skymission Group Holdings Limited (HKG:1429) shareholders would be excited to see that the share price has had a great month, posting a 70% gain and recovering from prior weakness. The bad news is that even after the stocks recovery in the last 30 days, shareholders are still underwater by about 8.9% over the last year.
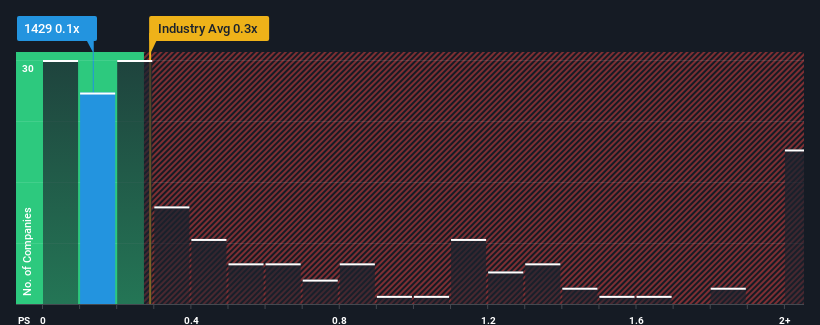
Even after such a large jump in price, there still wouldn't be many who think Skymission Group Holdings' price-to-sales (or "P/S") ratio of 0.1x is worth a mention when the median P/S in Hong Kong's Construction industry is similar at about 0.3x. While this might not raise any eyebrows, if the P/S ratio is not justified investors could be missing out on a potential opportunity or ignoring looming disappointment.
View our latest analysis for Skymission Group Holdings
How Skymission Group Holdings Has Been Performing
For example, consider that Skymission Group Holdings' financial performance has been pretty ordinary lately as revenue growth is non-existent. It might be that many expect the uninspiring revenue performance to only match most other companies at best over the coming period, which has kept the P/S from rising. Those who are bullish on Skymission Group Holdings will be hoping that this isn't the case, so that they can pick up the stock at a lower valuation.
We don't have analyst forecasts, but you can see how recent trends are setting up the company for the future by checking out our free report on Skymission Group Holdings' earnings, revenue and cash flow.Is There Some Revenue Growth Forecasted For Skymission Group Holdings?
In order to justify its P/S ratio, Skymission Group Holdings would need to produce growth that's similar to the industry.
Taking a look back first, we see that there was hardly any revenue growth to speak of for the company over the past year. Still, the latest three year period was better as it's delivered a decent 14% overall rise in revenue. So it appears to us that the company has had a mixed result in terms of growing revenue over that time.
This is in contrast to the rest of the industry, which is expected to grow by 10% over the next year, materially higher than the company's recent medium-term annualised growth rates.
With this information, we find it interesting that Skymission Group Holdings is trading at a fairly similar P/S compared to the industry. Apparently many investors in the company are less bearish than recent times would indicate and aren't willing to let go of their stock right now. Maintaining these prices will be difficult to achieve as a continuation of recent revenue trends is likely to weigh down the shares eventually.
What We Can Learn From Skymission Group Holdings' P/S?
Its shares have lifted substantially and now Skymission Group Holdings' P/S is back within range of the industry median. Typically, we'd caution against reading too much into price-to-sales ratios when settling on investment decisions, though it can reveal plenty about what other market participants think about the company.
We've established that Skymission Group Holdings' average P/S is a bit surprising since its recent three-year growth is lower than the wider industry forecast. When we see weak revenue with slower than industry growth, we suspect the share price is at risk of declining, bringing the P/S back in line with expectations. Unless there is a significant improvement in the company's medium-term performance, it will be difficult to prevent the P/S ratio from declining to a more reasonable level.
You need to take note of risks, for example - Skymission Group Holdings has 3 warning signs (and 1 which is potentially serious) we think you should know about.
If companies with solid past earnings growth is up your alley, you may wish to see this free collection of other companies with strong earnings growth and low P/E ratios.
New: Manage All Your Stock Portfolios in One Place
We've created the ultimate portfolio companion for stock investors, and it's free.
• Connect an unlimited number of Portfolios and see your total in one currency
• Be alerted to new Warning Signs or Risks via email or mobile
• Track the Fair Value of your stocks
Have feedback on this article? Concerned about the content? Get in touch with us directly. Alternatively, email editorial-team (at) simplywallst.com.
This article by Simply Wall St is general in nature. We provide commentary based on historical data and analyst forecasts only using an unbiased methodology and our articles are not intended to be financial advice. It does not constitute a recommendation to buy or sell any stock, and does not take account of your objectives, or your financial situation. We aim to bring you long-term focused analysis driven by fundamental data. Note that our analysis may not factor in the latest price-sensitive company announcements or qualitative material. Simply Wall St has no position in any stocks mentioned.
About SEHK:1429
Skymission Group Holdings
An investment holding company, operates as a formwork works subcontractor in Hong Kong.
Mediocre balance sheet low.
Market Insights

Advertisement
Community Narratives

BMW cruising ahead with new EVs and premium models to boost revenue 5%
Fair Value €135.07|44.6% undervalued
UN
Community Contributor
EU#2 - From Humble Beginnings to Global Powerhouse
Fair Value DKK 851.04|46.1% undervalued
TO
Community Contributor