- Hong Kong
- /
- Trade Distributors
- /
- SEHK:1341
Capital Allocation Trends At Hao Tian International Construction Investment Group (HKG:1341) Aren't Ideal


If we want to find a stock that could multiply over the long term, what are the underlying trends we should look for? In a perfect world, we'd like to see a company investing more capital into its business and ideally the returns earned from that capital are also increasing. Ultimately, this demonstrates that it's a business that is reinvesting profits at increasing rates of return. However, after briefly looking over the numbers, we don't think Hao Tian International Construction Investment Group (HKG:1341) has the makings of a multi-bagger going forward, but let's have a look at why that may be.
Return On Capital Employed (ROCE): What is it?
For those that aren't sure what ROCE is, it measures the amount of pre-tax profits a company can generate from the capital employed in its business. The formula for this calculation on Hao Tian International Construction Investment Group is:
Return on Capital Employed = Earnings Before Interest and Tax (EBIT) ÷ (Total Assets - Current Liabilities)
0.0097 = HK$24m ÷ (HK$2.9b - HK$425m) (Based on the trailing twelve months to March 2021).
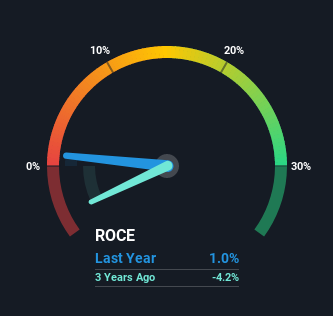
Therefore, Hao Tian International Construction Investment Group has an ROCE of 1.0%. Ultimately, that's a low return and it under-performs the Trade Distributors industry average of 4.6%.
Check out our latest analysis for Hao Tian International Construction Investment Group
While the past is not representative of the future, it can be helpful to know how a company has performed historically, which is why we have this chart above. If you'd like to look at how Hao Tian International Construction Investment Group has performed in the past in other metrics, you can view this free graph of past earnings, revenue and cash flow.
How Are Returns Trending?
When we looked at the ROCE trend at Hao Tian International Construction Investment Group, we didn't gain much confidence. Over the last five years, returns on capital have decreased to 1.0% from 1.2% five years ago. Although, given both revenue and the amount of assets employed in the business have increased, it could suggest the company is investing in growth, and the extra capital has led to a short-term reduction in ROCE. If these investments prove successful, this can bode very well for long term stock performance.
On a side note, Hao Tian International Construction Investment Group has done well to pay down its current liabilities to 15% of total assets. So we could link some of this to the decrease in ROCE. What's more, this can reduce some aspects of risk to the business because now the company's suppliers or short-term creditors are funding less of its operations. Since the business is basically funding more of its operations with it's own money, you could argue this has made the business less efficient at generating ROCE.
The Bottom Line On Hao Tian International Construction Investment Group's ROCE
In summary, despite lower returns in the short term, we're encouraged to see that Hao Tian International Construction Investment Group is reinvesting for growth and has higher sales as a result. These trends are starting to be recognized by investors since the stock has delivered a 11% gain to shareholders who've held over the last five years. Therefore we'd recommend looking further into this stock to confirm if it has the makings of a good investment.
If you want to know some of the risks facing Hao Tian International Construction Investment Group we've found 5 warning signs (1 is concerning!) that you should be aware of before investing here.
While Hao Tian International Construction Investment Group isn't earning the highest return, check out this free list of companies that are earning high returns on equity with solid balance sheets.
If you're looking to trade Hao Tian International Construction Investment Group, open an account with the lowest-cost platform trusted by professionals, Interactive Brokers.
With clients in over 200 countries and territories, and access to 160 markets, IBKR lets you trade stocks, options, futures, forex, bonds and funds from a single integrated account.
Enjoy no hidden fees, no account minimums, and FX conversion rates as low as 0.03%, far better than what most brokers offer.
Sponsored ContentValuation is complex, but we're here to simplify it.
Discover if Hao Tian International Construction Investment Group might be undervalued or overvalued with our detailed analysis, featuring fair value estimates, potential risks, dividends, insider trades, and its financial condition.
Access Free AnalysisThis article by Simply Wall St is general in nature. We provide commentary based on historical data and analyst forecasts only using an unbiased methodology and our articles are not intended to be financial advice. It does not constitute a recommendation to buy or sell any stock, and does not take account of your objectives, or your financial situation. We aim to bring you long-term focused analysis driven by fundamental data. Note that our analysis may not factor in the latest price-sensitive company announcements or qualitative material. Simply Wall St has no position in any stocks mentioned.
Have feedback on this article? Concerned about the content? Get in touch with us directly. Alternatively, email editorial-team (at) simplywallst.com.
About SEHK:1341
Hao Tian International Construction Investment Group
An investment holding company, engages in the rental and trade of construction machinery in Hong Kong, the United Kingdom, the People’s Republic of China, Malaysia, Cambodia, and Macau.
Mediocre balance sheet very low.
Market Insights

Community Narratives

