There's Reason For Concern Over D&G Technology Holding Company Limited's (HKG:1301) Massive 26% Price Jump


The D&G Technology Holding Company Limited (HKG:1301) share price has done very well over the last month, posting an excellent gain of 26%. Taking a wider view, although not as strong as the last month, the full year gain of 10% is also fairly reasonable.
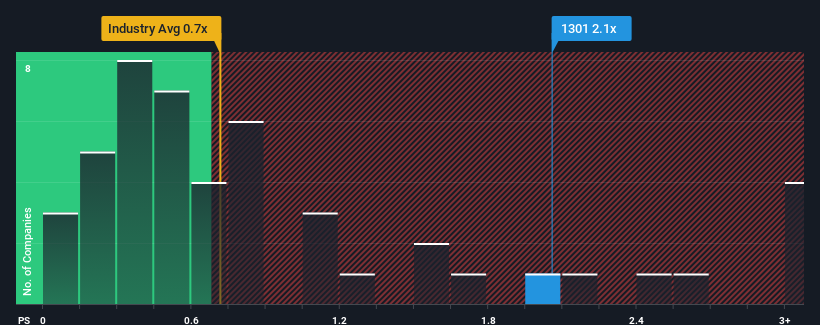
Since its price has surged higher, given close to half the companies operating in Hong Kong's Machinery industry have price-to-sales ratios (or "P/S") below 0.7x, you may consider D&G Technology Holding as a stock to potentially avoid with its 2.1x P/S ratio. Nonetheless, we'd need to dig a little deeper to determine if there is a rational basis for the elevated P/S.
Check out our latest analysis for D&G Technology Holding
What Does D&G Technology Holding's P/S Mean For Shareholders?
For example, consider that D&G Technology Holding's financial performance has been poor lately as its revenue has been in decline. Perhaps the market believes the company can do enough to outperform the rest of the industry in the near future, which is keeping the P/S ratio high. If not, then existing shareholders may be quite nervous about the viability of the share price.
Want the full picture on earnings, revenue and cash flow for the company? Then our free report on D&G Technology Holding will help you shine a light on its historical performance.What Are Revenue Growth Metrics Telling Us About The High P/S?
There's an inherent assumption that a company should outperform the industry for P/S ratios like D&G Technology Holding's to be considered reasonable.
In reviewing the last year of financials, we were disheartened to see the company's revenues fell to the tune of 20%. This means it has also seen a slide in revenue over the longer-term as revenue is down 27% in total over the last three years. Accordingly, shareholders would have felt downbeat about the medium-term rates of revenue growth.
In contrast to the company, the rest of the industry is expected to grow by 15% over the next year, which really puts the company's recent medium-term revenue decline into perspective.
With this information, we find it concerning that D&G Technology Holding is trading at a P/S higher than the industry. It seems most investors are ignoring the recent poor growth rate and are hoping for a turnaround in the company's business prospects. There's a very good chance existing shareholders are setting themselves up for future disappointment if the P/S falls to levels more in line with the recent negative growth rates.
What Does D&G Technology Holding's P/S Mean For Investors?
D&G Technology Holding shares have taken a big step in a northerly direction, but its P/S is elevated as a result. Typically, we'd caution against reading too much into price-to-sales ratios when settling on investment decisions, though it can reveal plenty about what other market participants think about the company.
We've established that D&G Technology Holding currently trades on a much higher than expected P/S since its recent revenues have been in decline over the medium-term. With a revenue decline on investors' minds, the likelihood of a souring sentiment is quite high which could send the P/S back in line with what we'd expect. If recent medium-term revenue trends continue, it will place shareholders' investments at significant risk and potential investors in danger of paying an excessive premium.
Don't forget that there may be other risks. For instance, we've identified 1 warning sign for D&G Technology Holding that you should be aware of.
If companies with solid past earnings growth is up your alley, you may wish to see this free collection of other companies with strong earnings growth and low P/E ratios.
New: Manage All Your Stock Portfolios in One Place
We've created the ultimate portfolio companion for stock investors, and it's free.
• Connect an unlimited number of Portfolios and see your total in one currency
• Be alerted to new Warning Signs or Risks via email or mobile
• Track the Fair Value of your stocks
Have feedback on this article? Concerned about the content? Get in touch with us directly. Alternatively, email editorial-team (at) simplywallst.com.
This article by Simply Wall St is general in nature. We provide commentary based on historical data and analyst forecasts only using an unbiased methodology and our articles are not intended to be financial advice. It does not constitute a recommendation to buy or sell any stock, and does not take account of your objectives, or your financial situation. We aim to bring you long-term focused analysis driven by fundamental data. Note that our analysis may not factor in the latest price-sensitive company announcements or qualitative material. Simply Wall St has no position in any stocks mentioned.
Have feedback on this article? Concerned about the content? Get in touch with us directly. Alternatively, email editorial-team@simplywallst.com
About SEHK:1301
D&G Technology Holding
Engages in manufacturing, distribution, research and development, and operating lease of asphalt mixing plants in the People’s Republic of China and internationally.
Flawless balance sheet with questionable track record.
Market Insights

Community Narratives

