
Advertisement
- Hong Kong
- /
- Construction
- /
- SEHK:1183
MECOM Power and Construction (HKG:1183) Could Be Struggling To Allocate Capital
What underlying fundamental trends can indicate that a company might be in decline? A business that's potentially in decline often shows two trends, a return on capital employed (ROCE) that's declining, and a base of capital employed that's also declining. This indicates to us that the business is not only shrinking the size of its net assets, but its returns are falling as well. So after we looked into MECOM Power and Construction (HKG:1183), the trends above didn't look too great.
What Is Return On Capital Employed (ROCE)?
Just to clarify if you're unsure, ROCE is a metric for evaluating how much pre-tax income (in percentage terms) a company earns on the capital invested in its business. To calculate this metric for MECOM Power and Construction, this is the formula:
Return on Capital Employed = Earnings Before Interest and Tax (EBIT) ÷ (Total Assets - Current Liabilities)
0.021 = MO$11m ÷ (MO$1.1b - MO$576m) (Based on the trailing twelve months to December 2023).
Thus, MECOM Power and Construction has an ROCE of 2.1%. In absolute terms, that's a low return and it also under-performs the Construction industry average of 7.8%.
Check out our latest analysis for MECOM Power and Construction
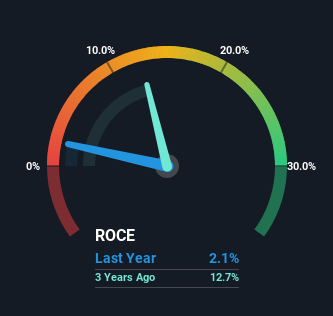
Historical performance is a great place to start when researching a stock so above you can see the gauge for MECOM Power and Construction's ROCE against it's prior returns. If you'd like to look at how MECOM Power and Construction has performed in the past in other metrics, you can view this free graph of MECOM Power and Construction's past earnings, revenue and cash flow.
The Trend Of ROCE
We are a bit worried about the trend of returns on capital at MECOM Power and Construction. Unfortunately the returns on capital have diminished from the 16% that they were earning five years ago. Meanwhile, capital employed in the business has stayed roughly the flat over the period. Since returns are falling and the business has the same amount of assets employed, this can suggest it's a mature business that hasn't had much growth in the last five years. So because these trends aren't typically conducive to creating a multi-bagger, we wouldn't hold our breath on MECOM Power and Construction becoming one if things continue as they have.
On a side note, MECOM Power and Construction's current liabilities have increased over the last five years to 53% of total assets, effectively distorting the ROCE to some degree. Without this increase, it's likely that ROCE would be even lower than 2.1%. And with current liabilities at these levels, suppliers or short-term creditors are effectively funding a large part of the business, which can introduce some risks.
In Conclusion...
All in all, the lower returns from the same amount of capital employed aren't exactly signs of a compounding machine. Investors haven't taken kindly to these developments, since the stock has declined 56% from where it was five years ago. Unless there is a shift to a more positive trajectory in these metrics, we would look elsewhere.
Since virtually every company faces some risks, it's worth knowing what they are, and we've spotted 3 warning signs for MECOM Power and Construction (of which 1 is potentially serious!) that you should know about.
While MECOM Power and Construction may not currently earn the highest returns, we've compiled a list of companies that currently earn more than 25% return on equity. Check out this free list here.
New: Manage All Your Stock Portfolios in One Place
We've created the ultimate portfolio companion for stock investors, and it's free.
• Connect an unlimited number of Portfolios and see your total in one currency
• Be alerted to new Warning Signs or Risks via email or mobile
• Track the Fair Value of your stocks
Have feedback on this article? Concerned about the content? Get in touch with us directly. Alternatively, email editorial-team (at) simplywallst.com.
This article by Simply Wall St is general in nature. We provide commentary based on historical data and analyst forecasts only using an unbiased methodology and our articles are not intended to be financial advice. It does not constitute a recommendation to buy or sell any stock, and does not take account of your objectives, or your financial situation. We aim to bring you long-term focused analysis driven by fundamental data. Note that our analysis may not factor in the latest price-sensitive company announcements or qualitative material. Simply Wall St has no position in any stocks mentioned.
About SEHK:1183
MECOM Power and Construction
Offers construction services in Macau, Hong Kong, Cyprus, and the People’s Republic of China.
Adequate balance sheet with questionable track record.
Market Insights

Advertisement
Community Narratives
Kodiak AI - a potential 100 bagger opportunity?
Fair Value US$14.00|44.7% undervalued
DA
Community Contributor
A Fair Price for a Great Business Facing Real Threats
Fair Value US$383.06|13.0% undervalued
IM
Community Contributor
AXON And Shopify Integration Will Unlock Global Mobile Advertising
Fair Value US$646.30|0% overvalued
AN
Based on Analyst Price Targets