
Advertisement
- Hong Kong
- /
- Trade Distributors
- /
- SEHK:1159
A Look At The Fair Value Of Starlight Culture Entertainment Group Limited (HKG:1159)

Key Insights
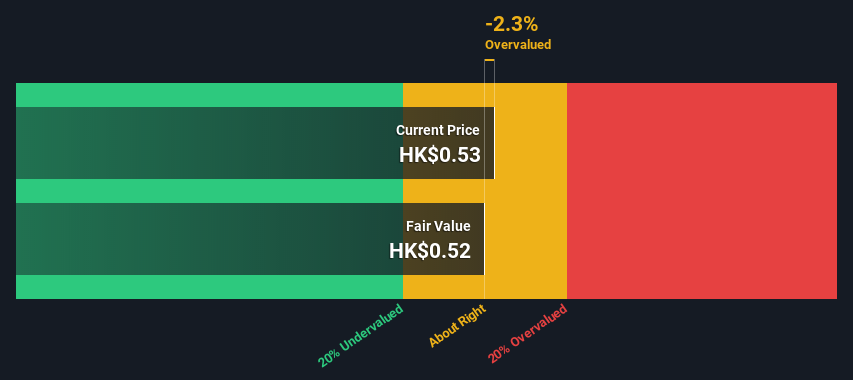
- Starlight Culture Entertainment Group's estimated fair value is HK$0.52 based on 2 Stage Free Cash Flow to Equity
- Current share price of HK$0.53 suggests Starlight Culture Entertainment Group is potentially trading close to its fair value
- When compared to theindustry average discount of -640%, Starlight Culture Entertainment Group's competitors seem to be trading at a greater premium to fair value
Today we will run through one way of estimating the intrinsic value of Starlight Culture Entertainment Group Limited (HKG:1159) by estimating the company's future cash flows and discounting them to their present value. The Discounted Cash Flow (DCF) model is the tool we will apply to do this. Believe it or not, it's not too difficult to follow, as you'll see from our example!
We would caution that there are many ways of valuing a company and, like the DCF, each technique has advantages and disadvantages in certain scenarios. Anyone interested in learning a bit more about intrinsic value should have a read of the Simply Wall St analysis model.
View our latest analysis for Starlight Culture Entertainment Group
Crunching The Numbers
We're using the 2-stage growth model, which simply means we take in account two stages of company's growth. In the initial period the company may have a higher growth rate and the second stage is usually assumed to have a stable growth rate. In the first stage we need to estimate the cash flows to the business over the next ten years. Seeing as no analyst estimates of free cash flow are available to us, we have extrapolate the previous free cash flow (FCF) from the company's last reported value. We assume companies with shrinking free cash flow will slow their rate of shrinkage, and that companies with growing free cash flow will see their growth rate slow, over this period. We do this to reflect that growth tends to slow more in the early years than it does in later years.
Generally we assume that a dollar today is more valuable than a dollar in the future, so we discount the value of these future cash flows to their estimated value in today's dollars:
10-year free cash flow (FCF) forecast
| 2023 | 2024 | 2025 | 2026 | 2027 | 2028 | 2029 | 2030 | 2031 | 2032 | |
| Levered FCF (HK$, Millions) | HK$79.1m | HK$62.0m | HK$52.9m | HK$47.7m | HK$44.7m | HK$43.0m | HK$42.0m | HK$41.6m | HK$41.5m | HK$41.7m |
| Growth Rate Estimate Source | Est @ -31.74% | Est @ -21.69% | Est @ -14.66% | Est @ -9.74% | Est @ -6.30% | Est @ -3.89% | Est @ -2.20% | Est @ -1.02% | Est @ -0.19% | Est @ 0.39% |
| Present Value (HK$, Millions) Discounted @ 12% | HK$70.5 | HK$49.2 | HK$37.5 | HK$30.1 | HK$25.2 | HK$21.6 | HK$18.8 | HK$16.6 | HK$14.8 | HK$13.2 |
("Est" = FCF growth rate estimated by Simply Wall St)
Present Value of 10-year Cash Flow (PVCF) = HK$298m
The second stage is also known as Terminal Value, this is the business's cash flow after the first stage. For a number of reasons a very conservative growth rate is used that cannot exceed that of a country's GDP growth. In this case we have used the 5-year average of the 10-year government bond yield (1.7%) to estimate future growth. In the same way as with the 10-year 'growth' period, we discount future cash flows to today's value, using a cost of equity of 12%.
Terminal Value (TV)= FCF2032 × (1 + g) ÷ (r – g) = HK$42m× (1 + 1.7%) ÷ (12%– 1.7%) = HK$407m
Present Value of Terminal Value (PVTV)= TV / (1 + r)10= HK$407m÷ ( 1 + 12%)10= HK$129m
The total value, or equity value, is then the sum of the present value of the future cash flows, which in this case is HK$427m. To get the intrinsic value per share, we divide this by the total number of shares outstanding. Compared to the current share price of HK$0.5, the company appears around fair value at the time of writing. The assumptions in any calculation have a big impact on the valuation, so it is better to view this as a rough estimate, not precise down to the last cent.
Important Assumptions
The calculation above is very dependent on two assumptions. The first is the discount rate and the other is the cash flows. You don't have to agree with these inputs, I recommend redoing the calculations yourself and playing with them. The DCF also does not consider the possible cyclicality of an industry, or a company's future capital requirements, so it does not give a full picture of a company's potential performance. Given that we are looking at Starlight Culture Entertainment Group as potential shareholders, the cost of equity is used as the discount rate, rather than the cost of capital (or weighted average cost of capital, WACC) which accounts for debt. In this calculation we've used 12%, which is based on a levered beta of 1.496. Beta is a measure of a stock's volatility, compared to the market as a whole. We get our beta from the industry average beta of globally comparable companies, with an imposed limit between 0.8 and 2.0, which is a reasonable range for a stable business.
SWOT Analysis for Starlight Culture Entertainment Group
Strength
- Debt is well covered by earnings and cashflows.
Weakness
- Current share price is above our estimate of fair value.
Opportunity
- Has sufficient cash runway for more than 3 years based on current free cash flows.
- Lack of analyst coverage makes it difficult to determine 1159's earnings prospects.
Threat
- Total liabilities exceed total assets, which raises the risk of financial distress.
Looking Ahead:
Valuation is only one side of the coin in terms of building your investment thesis, and it shouldn't be the only metric you look at when researching a company. DCF models are not the be-all and end-all of investment valuation. Rather it should be seen as a guide to "what assumptions need to be true for this stock to be under/overvalued?" For instance, if the terminal value growth rate is adjusted slightly, it can dramatically alter the overall result. For Starlight Culture Entertainment Group, there are three fundamental aspects you should explore:
- Risks: Consider for instance, the ever-present spectre of investment risk. We've identified 4 warning signs with Starlight Culture Entertainment Group (at least 3 which shouldn't be ignored) , and understanding these should be part of your investment process.
- Other High Quality Alternatives: Do you like a good all-rounder? Explore our interactive list of high quality stocks to get an idea of what else is out there you may be missing!
- Other Top Analyst Picks: Interested to see what the analysts are thinking? Take a look at our interactive list of analysts' top stock picks to find out what they feel might have an attractive future outlook!
PS. The Simply Wall St app conducts a discounted cash flow valuation for every stock on the SEHK every day. If you want to find the calculation for other stocks just search here.
New: Manage All Your Stock Portfolios in One Place
We've created the ultimate portfolio companion for stock investors, and it's free.
• Connect an unlimited number of Portfolios and see your total in one currency
• Be alerted to new Warning Signs or Risks via email or mobile
• Track the Fair Value of your stocks
Have feedback on this article? Concerned about the content? Get in touch with us directly. Alternatively, email editorial-team (at) simplywallst.com.
This article by Simply Wall St is general in nature. We provide commentary based on historical data and analyst forecasts only using an unbiased methodology and our articles are not intended to be financial advice. It does not constitute a recommendation to buy or sell any stock, and does not take account of your objectives, or your financial situation. We aim to bring you long-term focused analysis driven by fundamental data. Note that our analysis may not factor in the latest price-sensitive company announcements or qualitative material. Simply Wall St has no position in any stocks mentioned.
About SEHK:1159
Smart Digital Technology Group
Engages in the media and culture business in the United States, Hong Kong, and Mainland China.
Slight and slightly overvalued.
Market Insights

Advertisement
Community Narratives
Groundbreaking therapies that could change the treatment landscape for PTSD, fibromyalgia, MS & Alzheimer’s
Fair Value US$6.20|86.9% undervalued
CM
Community Contributor
DigitalOcean Will Grow 14% by Embracing AI with Paperspace Acquisition
Fair Value US$50.00|41.7% undervalued
NE
Community Contributor
Viant Technology: A Rising AdTech Challenger in the AI-Powered CTV Market
Fair Value US$38.61|63.2% undervalued
BL
Community Contributor
Volvo will Accelerate Forward into Electric and Autonomous Leadership in Five Years
Fair Value SEK 438.80|39.7% undervalued
UN
Community Contributor