- Hong Kong
- /
- Auto Components
- /
- SEHK:425
The past three years for Minth Group (HKG:425) investors has not been profitable


While it may not be enough for some shareholders, we think it is good to see the Minth Group Limited (HKG:425) share price up 15% in a single quarter. But over the last three years we've seen a quite serious decline. Indeed, the share price is down a tragic 54% in the last three years. So it's good to see it climbing back up. The rise has some hopeful, but turnarounds are often precarious.
It's worthwhile assessing if the company's economics have been moving in lockstep with these underwhelming shareholder returns, or if there is some disparity between the two. So let's do just that.
View our latest analysis for Minth Group
There is no denying that markets are sometimes efficient, but prices do not always reflect underlying business performance. One way to examine how market sentiment has changed over time is to look at the interaction between a company's share price and its earnings per share (EPS).
During the unfortunate three years of share price decline, Minth Group actually saw its earnings per share (EPS) improve by 11% per year. This is quite a puzzle, and suggests there might be something temporarily buoying the share price. Or else the company was over-hyped in the past, and so its growth has disappointed.
It's worth taking a look at other metrics, because the EPS growth doesn't seem to match with the falling share price.
Revenue is actually up 17% over the three years, so the share price drop doesn't seem to hinge on revenue, either. This analysis is just perfunctory, but it might be worth researching Minth Group more closely, as sometimes stocks fall unfairly. This could present an opportunity.
The image below shows how earnings and revenue have tracked over time (if you click on the image you can see greater detail).
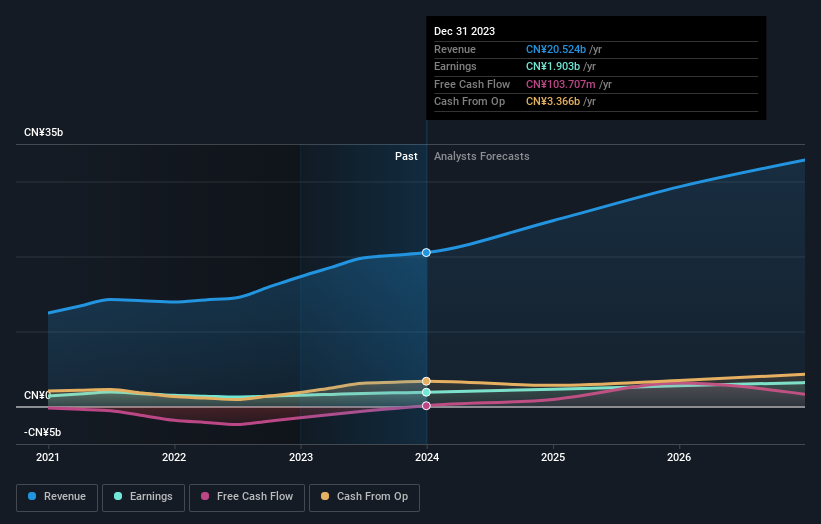
It's probably worth noting we've seen significant insider buying in the last quarter, which we consider a positive. On the other hand, we think the revenue and earnings trends are much more meaningful measures of the business. If you are thinking of buying or selling Minth Group stock, you should check out this free report showing analyst profit forecasts.
What About The Total Shareholder Return (TSR)?
We'd be remiss not to mention the difference between Minth Group's total shareholder return (TSR) and its share price return. The TSR attempts to capture the value of dividends (as if they were reinvested) as well as any spin-offs or discounted capital raisings offered to shareholders. Dividends have been really beneficial for Minth Group shareholders, and that cash payout explains why its total shareholder loss of 51%, over the last 3 years, isn't as bad as the share price return.
A Different Perspective
Investors in Minth Group had a tough year, with a total loss of 26%, against a market gain of about 5.3%. Even the share prices of good stocks drop sometimes, but we want to see improvements in the fundamental metrics of a business, before getting too interested. Regrettably, last year's performance caps off a bad run, with the shareholders facing a total loss of 3% per year over five years. We realise that Baron Rothschild has said investors should "buy when there is blood on the streets", but we caution that investors should first be sure they are buying a high quality business. Investors who like to make money usually check up on insider purchases, such as the price paid, and total amount bought. You can find out about the insider purchases of Minth Group by clicking this link.
If you like to buy stocks alongside management, then you might just love this free list of companies. (Hint: most of them are flying under the radar).
Please note, the market returns quoted in this article reflect the market weighted average returns of stocks that currently trade on Hong Kong exchanges.
New: Manage All Your Stock Portfolios in One Place
We've created the ultimate portfolio companion for stock investors, and it's free.
• Connect an unlimited number of Portfolios and see your total in one currency
• Be alerted to new Warning Signs or Risks via email or mobile
• Track the Fair Value of your stocks
Have feedback on this article? Concerned about the content? Get in touch with us directly. Alternatively, email editorial-team (at) simplywallst.com.
This article by Simply Wall St is general in nature. We provide commentary based on historical data and analyst forecasts only using an unbiased methodology and our articles are not intended to be financial advice. It does not constitute a recommendation to buy or sell any stock, and does not take account of your objectives, or your financial situation. We aim to bring you long-term focused analysis driven by fundamental data. Note that our analysis may not factor in the latest price-sensitive company announcements or qualitative material. Simply Wall St has no position in any stocks mentioned.
About SEHK:425
Minth Group
An investment holding company, designs, develops, manufactures, processes, and sells automobile body parts and moulds of passenger cars.
Undervalued with solid track record.
