Advertisement
- Greece
- /
- Electronic Equipment and Components
- /
- ATSE:INTET
The Return Trends At Intertech Inter. Technologies (ATH:INTET) Look Promising
What are the early trends we should look for to identify a stock that could multiply in value over the long term? One common approach is to try and find a company with returns on capital employed (ROCE) that are increasing, in conjunction with a growing amount of capital employed. This shows us that it's a compounding machine, able to continually reinvest its earnings back into the business and generate higher returns. So on that note, Intertech Inter. Technologies (ATH:INTET) looks quite promising in regards to its trends of return on capital.
What Is Return On Capital Employed (ROCE)?
For those that aren't sure what ROCE is, it measures the amount of pre-tax profits a company can generate from the capital employed in its business. The formula for this calculation on Intertech Inter. Technologies is:
Return on Capital Employed = Earnings Before Interest and Tax (EBIT) ÷ (Total Assets - Current Liabilities)
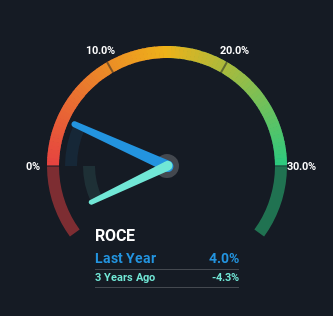
0.04 = €423k ÷ (€19m - €8.5m) (Based on the trailing twelve months to December 2023).
Thus, Intertech Inter. Technologies has an ROCE of 4.0%. In absolute terms, that's a low return and it also under-performs the Electronic industry average of 12%.
See our latest analysis for Intertech Inter. Technologies
While the past is not representative of the future, it can be helpful to know how a company has performed historically, which is why we have this chart above. If you're interested in investigating Intertech Inter. Technologies' past further, check out this free graph covering Intertech Inter. Technologies' past earnings, revenue and cash flow.
The Trend Of ROCE
Intertech Inter. Technologies has broken into the black (profitability) and we're sure it's a sight for sore eyes. The company was generating losses five years ago, but has managed to turn it around and as we saw earlier is now earning 4.0%, which is always encouraging. While returns have increased, the amount of capital employed by Intertech Inter. Technologies has remained flat over the period. That being said, while an increase in efficiency is no doubt appealing, it'd be helpful to know if the company does have any investment plans going forward. So if you're looking for high growth, you'll want to see a business's capital employed also increasing.
On a side note, Intertech Inter. Technologies' current liabilities are still rather high at 45% of total assets. This can bring about some risks because the company is basically operating with a rather large reliance on its suppliers or other sorts of short-term creditors. While it's not necessarily a bad thing, it can be beneficial if this ratio is lower.
The Bottom Line
In summary, we're delighted to see that Intertech Inter. Technologies has been able to increase efficiencies and earn higher rates of return on the same amount of capital. And a remarkable 129% total return over the last five years tells us that investors are expecting more good things to come in the future. In light of that, we think it's worth looking further into this stock because if Intertech Inter. Technologies can keep these trends up, it could have a bright future ahead.
If you want to continue researching Intertech Inter. Technologies, you might be interested to know about the 2 warning signs that our analysis has discovered.
While Intertech Inter. Technologies may not currently earn the highest returns, we've compiled a list of companies that currently earn more than 25% return on equity. Check out this free list here.
New: AI Stock Screener & Alerts
Our new AI Stock Screener scans the market every day to uncover opportunities.
• Dividend Powerhouses (3%+ Yield)
• Undervalued Small Caps with Insider Buying
• High growth Tech and AI Companies
Or build your own from over 50 metrics.
Have feedback on this article? Concerned about the content? Get in touch with us directly. Alternatively, email editorial-team (at) simplywallst.com.
This article by Simply Wall St is general in nature. We provide commentary based on historical data and analyst forecasts only using an unbiased methodology and our articles are not intended to be financial advice. It does not constitute a recommendation to buy or sell any stock, and does not take account of your objectives, or your financial situation. We aim to bring you long-term focused analysis driven by fundamental data. Note that our analysis may not factor in the latest price-sensitive company announcements or qualitative material. Simply Wall St has no position in any stocks mentioned.
About ATSE:INTET
Intertech Inter. Technologies
Distributes technology products in Greece.
Adequate balance sheet and fair value.
Market Insights


Advertisement
Weekly Picks
LO


Lou_Basenese on Virtuix Holdings ·
From a “Shark Tank” Snub to an Air Force “Yes”: Why Virtuix at $3.50 May Be the Market’s Most Mispriced AI Story
Fair Value:US$7.557.6% undervalued
17 followersusers have followed this narrative
0 commentsusers have commented on this narrative
2 likesusers have liked this narrative
IN


Investingwilly on Mastercard ·
Mastercard: The Best Dividend Stock You're Ignoring
Fair Value:US$75034.8% undervalued
63 followersusers have followed this narrative
1 commentusers have commented on this narrative
7 likesusers have liked this narrative
TR


tripledub on Intuit ·
A Wonderful Business at a Not-So-Wonderful Price
Fair Value:US$56054.5% undervalued
61 followersusers have followed this narrative
4 commentsusers have commented on this narrative
29 likesusers have liked this narrative
TA


Talos on MindWalk Holdings ·
The Asymmetric TechBio Play: MindWalk Holdings and the Valuation Disconnect
Fair Value:US$8.2781.6% undervalued
33 followersusers have followed this narrative
0 commentsusers have commented on this narrative
8 likesusers have liked this narrative
Recently Updated Narratives
AN


AntonioS on CAR Group ·
CAR Group. A wonderful compounding franchise at a fair-not-cheap price.
Fair Value:AU$3219.2% undervalued
1 followerusers have followed this narrative
0 commentsusers have commented on this narrative
0 likesusers have liked this narrative
GA

GaryB on Palantir Technologies ·
Palantir hits 52 week low.
Fair Value:US$274.861.0% undervalued
1 followerusers have followed this narrative
0 commentsusers have commented on this narrative
0 likesusers have liked this narrative
NO

North49_ on iShares - iShares MSCI South Korea ETF ·
EWY:US NYSE Arca iShares Msci South Korea ETF, an opportunity to diversify your tech investments.
Fair Value:US$273.4525.0% undervalued
2 followersusers have followed this narrative
0 commentsusers have commented on this narrative
0 likesusers have liked this narrative
Popular Narratives
HA


HarishPK on Adobe ·
Adobe: A Probabilistic Case for Undervaluation
Fair Value:US$319.9639.6% undervalued
61 followersusers have followed this narrative
9 commentsusers have commented on this narrative
18 likesusers have liked this narrative
MA


martinarauz on Nu Holdings ·
Investment Analysis (May 2026)
Fair Value:US$22.7445.2% undervalued
67 followersusers have followed this narrative
0 commentsusers have commented on this narrative
16 likesusers have liked this narrative
IN
Investingwilly on Mastercard ·
Mastercard: The Best Dividend Stock You're Ignoring
Fair Value:US$75034.8% undervalued
63 followersusers have followed this narrative
1 commentusers have commented on this narrative
7 likesusers have liked this narrative
