
Advertisement
- United Kingdom
- /
- Water Utilities
- /
- LSE:SVT
The five-year decline in earnings might be taking its toll on Severn Trent (LON:SVT) shareholders as stock falls 4.4% over the past week
When we invest, we're generally looking for stocks that outperform the market average. And the truth is, you can make significant gains if you buy good quality businesses at the right price. For example, the Severn Trent PLC (LON:SVT) share price is up 16% in the last 5 years, clearly besting the market return of around 3.3% (ignoring dividends). On the other hand, the more recent gains haven't been so impressive, with shareholders gaining just 14%, including dividends.
While the stock has fallen 4.4% this week, it's worth focusing on the longer term and seeing if the stocks historical returns have been driven by the underlying fundamentals.
See our latest analysis for Severn Trent
To paraphrase Benjamin Graham: Over the short term the market is a voting machine, but over the long term it's a weighing machine. By comparing earnings per share (EPS) and share price changes over time, we can get a feel for how investor attitudes to a company have morphed over time.
Severn Trent's earnings per share are down 19% per year, despite strong share price performance over five years.
Since the EPS are down strongly, it seems highly unlikely market participants are looking at EPS to value the company. Given that EPS is down, but the share price is up, it seems clear the market is focussed on other aspects of the business, at the moment.
We note that the dividend is higher than it was previously - always nice to see. Maybe dividend investors have helped support the share price. The revenue growth of about 5.7% per year might also encourage buyers.
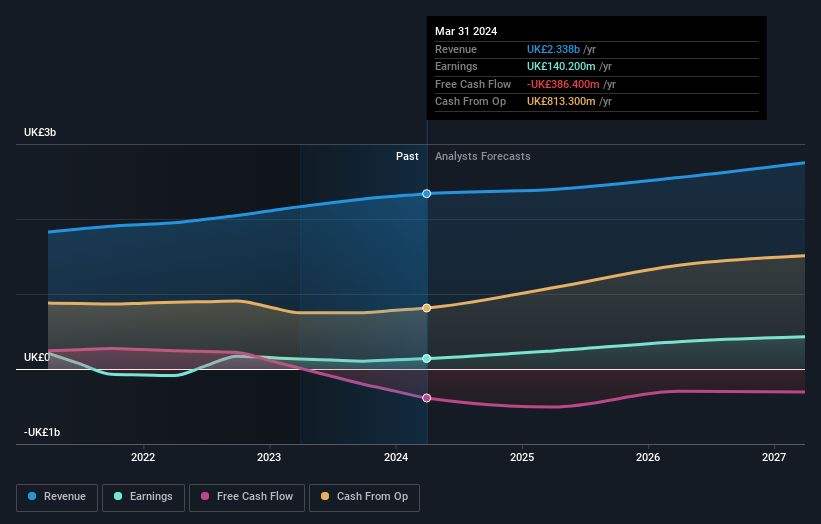
The image below shows how earnings and revenue have tracked over time (if you click on the image you can see greater detail).
Severn Trent is a well known stock, with plenty of analyst coverage, suggesting some visibility into future growth. If you are thinking of buying or selling Severn Trent stock, you should check out this free report showing analyst consensus estimates for future profits.
What About Dividends?
When looking at investment returns, it is important to consider the difference between total shareholder return (TSR) and share price return. The TSR is a return calculation that accounts for the value of cash dividends (assuming that any dividend received was reinvested) and the calculated value of any discounted capital raisings and spin-offs. Arguably, the TSR gives a more comprehensive picture of the return generated by a stock. We note that for Severn Trent the TSR over the last 5 years was 42%, which is better than the share price return mentioned above. This is largely a result of its dividend payments!
A Different Perspective
Severn Trent provided a TSR of 14% over the year (including dividends). That's fairly close to the broader market return. Most would be happy with a gain, and it helps that the year's return is actually better than the average return over five years, which was 7%. It is possible that management foresight will bring growth well into the future, even if the share price slows down. I find it very interesting to look at share price over the long term as a proxy for business performance. But to truly gain insight, we need to consider other information, too. Consider for instance, the ever-present spectre of investment risk. We've identified 2 warning signs with Severn Trent , and understanding them should be part of your investment process.
For those who like to find winning investments this free list of undervalued companies with recent insider purchasing, could be just the ticket.
Please note, the market returns quoted in this article reflect the market weighted average returns of stocks that currently trade on British exchanges.
New: Manage All Your Stock Portfolios in One Place
We've created the ultimate portfolio companion for stock investors, and it's free.
• Connect an unlimited number of Portfolios and see your total in one currency
• Be alerted to new Warning Signs or Risks via email or mobile
• Track the Fair Value of your stocks
Have feedback on this article? Concerned about the content? Get in touch with us directly. Alternatively, email editorial-team (at) simplywallst.com.
This article by Simply Wall St is general in nature. We provide commentary based on historical data and analyst forecasts only using an unbiased methodology and our articles are not intended to be financial advice. It does not constitute a recommendation to buy or sell any stock, and does not take account of your objectives, or your financial situation. We aim to bring you long-term focused analysis driven by fundamental data. Note that our analysis may not factor in the latest price-sensitive company announcements or qualitative material. Simply Wall St has no position in any stocks mentioned.
About LSE:SVT
Severn Trent
Provides water and wastewater services in the United Kingdom.
Reasonable growth potential with proven track record.
Similar Companies
Market Insights

Advertisement
Community Narratives
MicroVision will explode future revenue by 380.37% with a vision towards success
Fair Value US$60.00|98.4% undervalued
TH
Community Contributor
The Indispensable Artery for a New North American Economy
Fair Value CA$132.87|1.3% undervalued
TI
Community Contributor