The five-year decline in earnings for Spectris LON:SXS) isn't encouraging, but shareholders are still up 61% over that period


Stock pickers are generally looking for stocks that will outperform the broader market. And the truth is, you can make significant gains if you buy good quality businesses at the right price. For example, long term Spectris plc (LON:SXS) shareholders have enjoyed a 43% share price rise over the last half decade, well in excess of the market decline of around 7.0% (not including dividends). However, more recent returns haven't been as impressive as that, with the stock returning just 23% in the last year , including dividends .
In light of the stock dropping 5.1% in the past week, we want to investigate the longer term story, and see if fundamentals have been the driver of the company's positive five-year return.
See our latest analysis for Spectris
To paraphrase Benjamin Graham: Over the short term the market is a voting machine, but over the long term it's a weighing machine. One flawed but reasonable way to assess how sentiment around a company has changed is to compare the earnings per share (EPS) with the share price.
During five years of share price growth, Spectris actually saw its EPS drop 12% per year.
Essentially, it doesn't seem likely that investors are focused on EPS. Because earnings per share don't seem to match up with the share price, we'll take a look at other metrics instead.
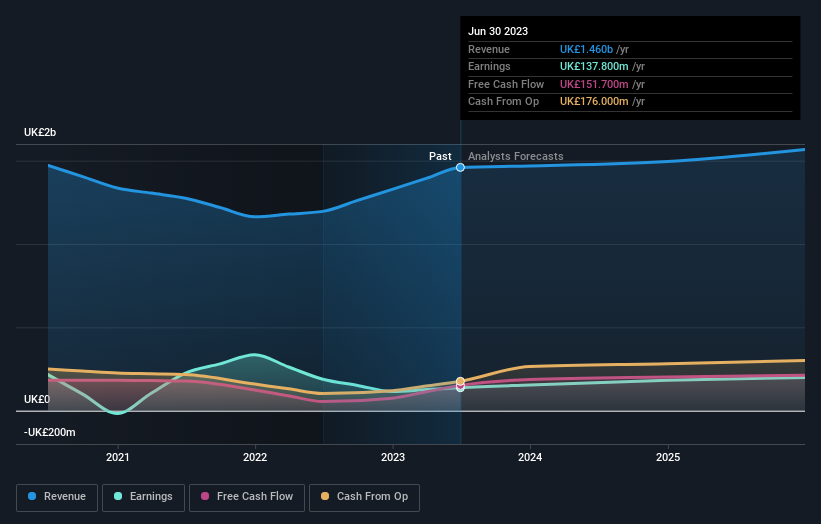
It is not great to see that revenue has dropped by 5.7% per year over five years. It certainly surprises us that the share price is up, but perhaps a closer examination of the data will yield answers.
You can see how earnings and revenue have changed over time in the image below (click on the chart to see the exact values).
Spectris is a well known stock, with plenty of analyst coverage, suggesting some visibility into future growth. So we recommend checking out this free report showing consensus forecasts
What About Dividends?
When looking at investment returns, it is important to consider the difference between total shareholder return (TSR) and share price return. Whereas the share price return only reflects the change in the share price, the TSR includes the value of dividends (assuming they were reinvested) and the benefit of any discounted capital raising or spin-off. It's fair to say that the TSR gives a more complete picture for stocks that pay a dividend. In the case of Spectris, it has a TSR of 61% for the last 5 years. That exceeds its share price return that we previously mentioned. This is largely a result of its dividend payments!
A Different Perspective
We're pleased to report that Spectris shareholders have received a total shareholder return of 23% over one year. And that does include the dividend. Since the one-year TSR is better than the five-year TSR (the latter coming in at 10% per year), it would seem that the stock's performance has improved in recent times. Someone with an optimistic perspective could view the recent improvement in TSR as indicating that the business itself is getting better with time. It's always interesting to track share price performance over the longer term. But to understand Spectris better, we need to consider many other factors. To that end, you should be aware of the 1 warning sign we've spotted with Spectris .
If you would prefer to check out another company -- one with potentially superior financials -- then do not miss this free list of companies that have proven they can grow earnings.
Please note, the market returns quoted in this article reflect the market weighted average returns of stocks that currently trade on British exchanges.
New: Manage All Your Stock Portfolios in One Place
We've created the ultimate portfolio companion for stock investors, and it's free.
• Connect an unlimited number of Portfolios and see your total in one currency
• Be alerted to new Warning Signs or Risks via email or mobile
• Track the Fair Value of your stocks
Have feedback on this article? Concerned about the content? Get in touch with us directly. Alternatively, email editorial-team (at) simplywallst.com.
This article by Simply Wall St is general in nature. We provide commentary based on historical data and analyst forecasts only using an unbiased methodology and our articles are not intended to be financial advice. It does not constitute a recommendation to buy or sell any stock, and does not take account of your objectives, or your financial situation. We aim to bring you long-term focused analysis driven by fundamental data. Note that our analysis may not factor in the latest price-sensitive company announcements or qualitative material. Simply Wall St has no position in any stocks mentioned.
About LSE:SXS
Very undervalued with proven track record and pays a dividend.
Similar Companies
Market Insights

Community Narratives

