Does Halma (LON:HLMA) Have A Healthy Balance Sheet?


Legendary fund manager Li Lu (who Charlie Munger backed) once said, 'The biggest investment risk is not the volatility of prices, but whether you will suffer a permanent loss of capital.' So it seems the smart money knows that debt - which is usually involved in bankruptcies - is a very important factor, when you assess how risky a company is. We can see that Halma plc (LON:HLMA) does use debt in its business. But the real question is whether this debt is making the company risky.
Why Does Debt Bring Risk?
Generally speaking, debt only becomes a real problem when a company can't easily pay it off, either by raising capital or with its own cash flow. Ultimately, if the company can't fulfill its legal obligations to repay debt, shareholders could walk away with nothing. However, a more common (but still painful) scenario is that it has to raise new equity capital at a low price, thus permanently diluting shareholders. Of course, debt can be an important tool in businesses, particularly capital heavy businesses. The first thing to do when considering how much debt a business uses is to look at its cash and debt together.
View our latest analysis for Halma
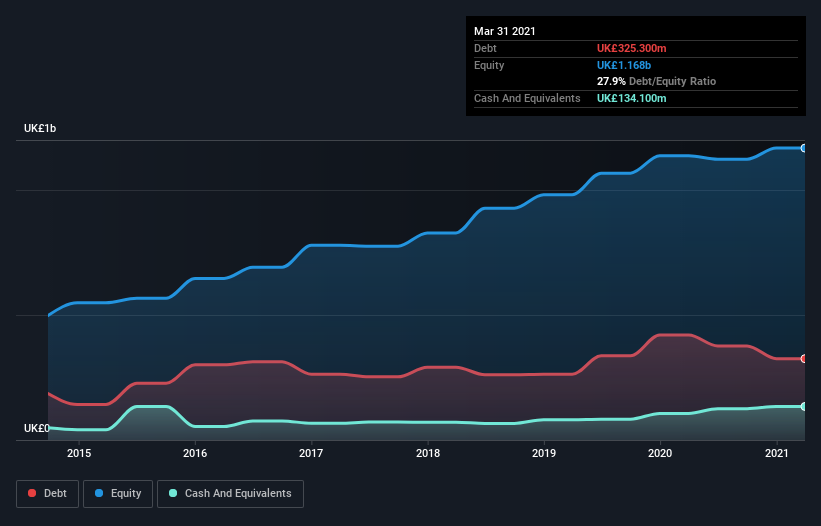
How Much Debt Does Halma Carry?
As you can see below, Halma had UK£325.3m of debt at March 2021, down from UK£420.1m a year prior. However, it also had UK£134.1m in cash, and so its net debt is UK£191.2m.
How Healthy Is Halma's Balance Sheet?
According to the last reported balance sheet, Halma had liabilities of UK£248.0m due within 12 months, and liabilities of UK£462.3m due beyond 12 months. Offsetting this, it had UK£134.1m in cash and UK£253.1m in receivables that were due within 12 months. So it has liabilities totalling UK£323.1m more than its cash and near-term receivables, combined.
Given Halma has a humongous market capitalization of UK£10.9b, it's hard to believe these liabilities pose much threat. But there are sufficient liabilities that we would certainly recommend shareholders continue to monitor the balance sheet, going forward.
In order to size up a company's debt relative to its earnings, we calculate its net debt divided by its earnings before interest, tax, depreciation, and amortization (EBITDA) and its earnings before interest and tax (EBIT) divided by its interest expense (its interest cover). The advantage of this approach is that we take into account both the absolute quantum of debt (with net debt to EBITDA) and the actual interest expenses associated with that debt (with its interest cover ratio).
Halma's net debt is only 0.61 times its EBITDA. And its EBIT covers its interest expense a whopping 24.6 times over. So you could argue it is no more threatened by its debt than an elephant is by a mouse. The good news is that Halma has increased its EBIT by 2.5% over twelve months, which should ease any concerns about debt repayment. The balance sheet is clearly the area to focus on when you are analysing debt. But it is future earnings, more than anything, that will determine Halma's ability to maintain a healthy balance sheet going forward. So if you're focused on the future you can check out this free report showing analyst profit forecasts.
Finally, a business needs free cash flow to pay off debt; accounting profits just don't cut it. So it's worth checking how much of that EBIT is backed by free cash flow. During the last three years, Halma generated free cash flow amounting to a very robust 88% of its EBIT, more than we'd expect. That positions it well to pay down debt if desirable to do so.
Our View
The good news is that Halma's demonstrated ability to cover its interest expense with its EBIT delights us like a fluffy puppy does a toddler. And the good news does not stop there, as its conversion of EBIT to free cash flow also supports that impression! Zooming out, Halma seems to use debt quite reasonably; and that gets the nod from us. After all, sensible leverage can boost returns on equity. Above most other metrics, we think its important to track how fast earnings per share is growing, if at all. If you've also come to that realization, you're in luck, because today you can view this interactive graph of Halma's earnings per share history for free.
When all is said and done, sometimes its easier to focus on companies that don't even need debt. Readers can access a list of growth stocks with zero net debt 100% free, right now.
If you decide to trade Halma, use the lowest-cost* platform that is rated #1 Overall by Barron’s, Interactive Brokers. Trade stocks, options, futures, forex, bonds and funds on 135 markets, all from a single integrated account. Promoted
If you're looking to trade Halma, open an account with the lowest-cost platform trusted by professionals, Interactive Brokers.
With clients in over 200 countries and territories, and access to 160 markets, IBKR lets you trade stocks, options, futures, forex, bonds and funds from a single integrated account.
Enjoy no hidden fees, no account minimums, and FX conversion rates as low as 0.03%, far better than what most brokers offer.
Sponsored ContentValuation is complex, but we're here to simplify it.
Discover if Halma might be undervalued or overvalued with our detailed analysis, featuring fair value estimates, potential risks, dividends, insider trades, and its financial condition.
Access Free AnalysisThis article by Simply Wall St is general in nature. It does not constitute a recommendation to buy or sell any stock, and does not take account of your objectives, or your financial situation. We aim to bring you long-term focused analysis driven by fundamental data. Note that our analysis may not factor in the latest price-sensitive company announcements or qualitative material. Simply Wall St has no position in any stocks mentioned.
*Interactive Brokers Rated Lowest Cost Broker by StockBrokers.com Annual Online Review 2020
Have feedback on this article? Concerned about the content? Get in touch with us directly. Alternatively, email editorial-team (at) simplywallst.com.
About LSE:HLMA
Halma
Together its subsidiaries, provides technology solutions in the safety, health, and environmental markets in the United States, Mainland Europe, the United Kingdom, the Asia Pacific, Africa, the Middle East, and internationally.
Solid track record with excellent balance sheet.
Similar Companies
Market Insights

Community Narratives

