Does Halma (LON:HLMA) Have A Healthy Balance Sheet?


David Iben put it well when he said, 'Volatility is not a risk we care about. What we care about is avoiding the permanent loss of capital.' When we think about how risky a company is, we always like to look at its use of debt, since debt overload can lead to ruin. As with many other companies Halma plc (LON:HLMA) makes use of debt. But the more important question is: how much risk is that debt creating?
Why Does Debt Bring Risk?
Debt assists a business until the business has trouble paying it off, either with new capital or with free cash flow. In the worst case scenario, a company can go bankrupt if it cannot pay its creditors. While that is not too common, we often do see indebted companies permanently diluting shareholders because lenders force them to raise capital at a distressed price. Of course, the upside of debt is that it often represents cheap capital, especially when it replaces dilution in a company with the ability to reinvest at high rates of return. When we examine debt levels, we first consider both cash and debt levels, together.
View our latest analysis for Halma
How Much Debt Does Halma Carry?
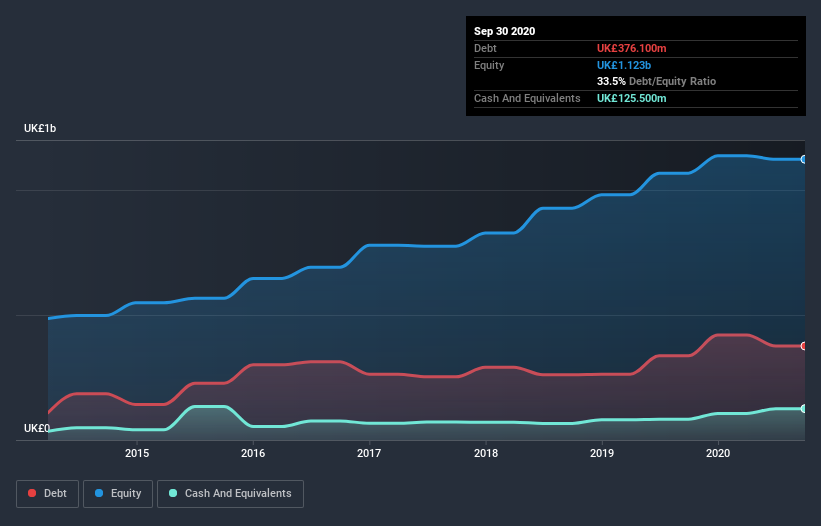
The image below, which you can click on for greater detail, shows that at September 2020 Halma had debt of UK£376.1m, up from UK£336.6m in one year. However, it does have UK£125.5m in cash offsetting this, leading to net debt of about UK£250.6m.
A Look At Halma's Liabilities
The latest balance sheet data shows that Halma had liabilities of UK£290.5m due within a year, and liabilities of UK£468.7m falling due after that. Offsetting this, it had UK£125.5m in cash and UK£251.8m in receivables that were due within 12 months. So it has liabilities totalling UK£381.9m more than its cash and near-term receivables, combined.
Of course, Halma has a titanic market capitalization of UK£8.51b, so these liabilities are probably manageable. However, we do think it is worth keeping an eye on its balance sheet strength, as it may change over time.
We measure a company's debt load relative to its earnings power by looking at its net debt divided by its earnings before interest, tax, depreciation, and amortization (EBITDA) and by calculating how easily its earnings before interest and tax (EBIT) cover its interest expense (interest cover). The advantage of this approach is that we take into account both the absolute quantum of debt (with net debt to EBITDA) and the actual interest expenses associated with that debt (with its interest cover ratio).
Halma's net debt is only 0.84 times its EBITDA. And its EBIT covers its interest expense a whopping 19.0 times over. So you could argue it is no more threatened by its debt than an elephant is by a mouse. But the other side of the story is that Halma saw its EBIT decline by 2.0% over the last year. If earnings continue to decline at that rate the company may have increasing difficulty managing its debt load. There's no doubt that we learn most about debt from the balance sheet. But ultimately the future profitability of the business will decide if Halma can strengthen its balance sheet over time. So if you're focused on the future you can check out this free report showing analyst profit forecasts.
Finally, while the tax-man may adore accounting profits, lenders only accept cold hard cash. So we clearly need to look at whether that EBIT is leading to corresponding free cash flow. Over the last three years, Halma recorded free cash flow worth a fulsome 87% of its EBIT, which is stronger than we'd usually expect. That positions it well to pay down debt if desirable to do so.
Our View
The good news is that Halma's demonstrated ability to cover its interest expense with its EBIT delights us like a fluffy puppy does a toddler. But truth be told we feel its EBIT growth rate does undermine this impression a bit. Zooming out, Halma seems to use debt quite reasonably; and that gets the nod from us. After all, sensible leverage can boost returns on equity. Above most other metrics, we think its important to track how fast earnings per share is growing, if at all. If you've also come to that realization, you're in luck, because today you can view this interactive graph of Halma's earnings per share history for free.
Of course, if you're the type of investor who prefers buying stocks without the burden of debt, then don't hesitate to discover our exclusive list of net cash growth stocks, today.
If you’re looking to trade Halma, open an account with the lowest-cost* platform trusted by professionals, Interactive Brokers. Their clients from over 200 countries and territories trade stocks, options, futures, forex, bonds and funds worldwide from a single integrated account. Promoted
If you're looking to trade Halma, open an account with the lowest-cost platform trusted by professionals, Interactive Brokers.
With clients in over 200 countries and territories, and access to 160 markets, IBKR lets you trade stocks, options, futures, forex, bonds and funds from a single integrated account.
Enjoy no hidden fees, no account minimums, and FX conversion rates as low as 0.03%, far better than what most brokers offer.
Sponsored ContentValuation is complex, but we're here to simplify it.
Discover if Halma might be undervalued or overvalued with our detailed analysis, featuring fair value estimates, potential risks, dividends, insider trades, and its financial condition.
Access Free AnalysisThis article by Simply Wall St is general in nature. It does not constitute a recommendation to buy or sell any stock, and does not take account of your objectives, or your financial situation. We aim to bring you long-term focused analysis driven by fundamental data. Note that our analysis may not factor in the latest price-sensitive company announcements or qualitative material. Simply Wall St has no position in any stocks mentioned.
*Interactive Brokers Rated Lowest Cost Broker by StockBrokers.com Annual Online Review 2020
Have feedback on this article? Concerned about the content? Get in touch with us directly. Alternatively, email editorial-team (at) simplywallst.com.
About LSE:HLMA
Halma
Together its subsidiaries, provides technology solutions in the safety, health, and environmental markets in the United States, Mainland Europe, the United Kingdom, the Asia Pacific, Africa, the Middle East, and internationally.
Solid track record with excellent balance sheet.
Similar Companies
Market Insights

Community Narratives

