Stock Analysis
Spectra Systems' (LON:SPSY) 18% CAGR outpaced the company's earnings growth over the same five-year period


When we invest, we're generally looking for stocks that outperform the market average. And the truth is, you can make significant gains if you buy good quality businesses at the right price. For example, long term Spectra Systems Corporation (LON:SPSY) shareholders have enjoyed a 78% share price rise over the last half decade, well in excess of the market return of around 2.4% (not including dividends). On the other hand, the more recent gains haven't been so impressive, with shareholders gaining just 49% , including dividends .
Since the stock has added UK£11m to its market cap in the past week alone, let's see if underlying performance has been driving long-term returns.
See our latest analysis for Spectra Systems
In his essay The Superinvestors of Graham-and-Doddsville Warren Buffett described how share prices do not always rationally reflect the value of a business. By comparing earnings per share (EPS) and share price changes over time, we can get a feel for how investor attitudes to a company have morphed over time.
During five years of share price growth, Spectra Systems achieved compound earnings per share (EPS) growth of 14% per year. So the EPS growth rate is rather close to the annualized share price gain of 12% per year. Therefore one could conclude that sentiment towards the shares hasn't morphed very much. Rather, the share price has approximately tracked EPS growth.
You can see how EPS has changed over time in the image below (click on the chart to see the exact values).
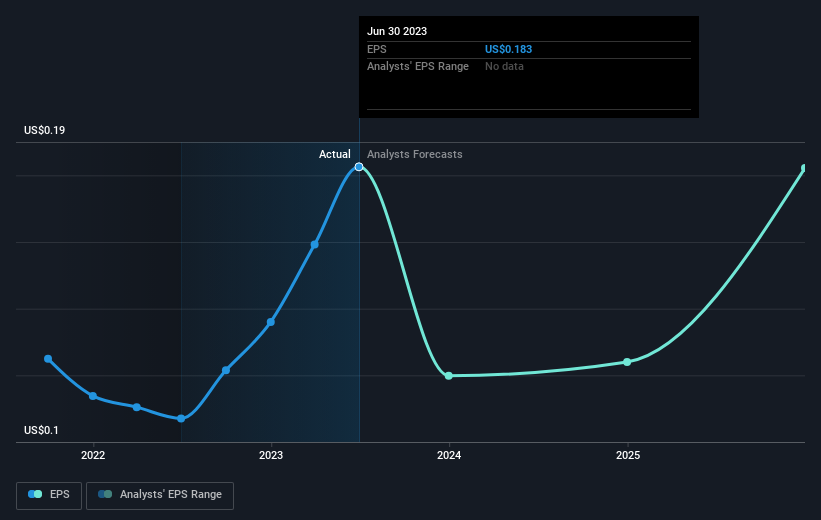
We know that Spectra Systems has improved its bottom line lately, but is it going to grow revenue? If you're interested, you could check this free report showing consensus revenue forecasts.
What About Dividends?
It is important to consider the total shareholder return, as well as the share price return, for any given stock. The TSR is a return calculation that accounts for the value of cash dividends (assuming that any dividend received was reinvested) and the calculated value of any discounted capital raisings and spin-offs. It's fair to say that the TSR gives a more complete picture for stocks that pay a dividend. As it happens, Spectra Systems' TSR for the last 5 years was 129%, which exceeds the share price return mentioned earlier. The dividends paid by the company have thusly boosted the total shareholder return.
A Different Perspective
It's good to see that Spectra Systems has rewarded shareholders with a total shareholder return of 49% in the last twelve months. And that does include the dividend. That gain is better than the annual TSR over five years, which is 18%. Therefore it seems like sentiment around the company has been positive lately. Someone with an optimistic perspective could view the recent improvement in TSR as indicating that the business itself is getting better with time. It's always interesting to track share price performance over the longer term. But to understand Spectra Systems better, we need to consider many other factors. Take risks, for example - Spectra Systems has 2 warning signs (and 1 which is a bit concerning) we think you should know about.
If you are like me, then you will not want to miss this free list of growing companies that insiders are buying.
Please note, the market returns quoted in this article reflect the market weighted average returns of stocks that currently trade on British exchanges.
Valuation is complex, but we're helping make it simple.
Find out whether Spectra Systems is potentially over or undervalued by checking out our comprehensive analysis, which includes fair value estimates, risks and warnings, dividends, insider transactions and financial health.
View the Free AnalysisHave feedback on this article? Concerned about the content? Get in touch with us directly. Alternatively, email editorial-team (at) simplywallst.com.
This article by Simply Wall St is general in nature. We provide commentary based on historical data and analyst forecasts only using an unbiased methodology and our articles are not intended to be financial advice. It does not constitute a recommendation to buy or sell any stock, and does not take account of your objectives, or your financial situation. We aim to bring you long-term focused analysis driven by fundamental data. Note that our analysis may not factor in the latest price-sensitive company announcements or qualitative material. Simply Wall St has no position in any stocks mentioned.
About AIM:SPSY
Spectra Systems
Spectra Systems Corporation invents, develops, and sells integrated optical systems in the United States and internationally.
Excellent balance sheet and good value.
