
Advertisement
Slammed 28% Northamber plc (LON:NAR) Screens Well Here But There Might Be A Catch
Northamber plc (LON:NAR) shareholders won't be pleased to see that the share price has had a very rough month, dropping 28% and undoing the prior period's positive performance. The drop over the last 30 days has capped off a tough year for shareholders, with the share price down 14% in that time.
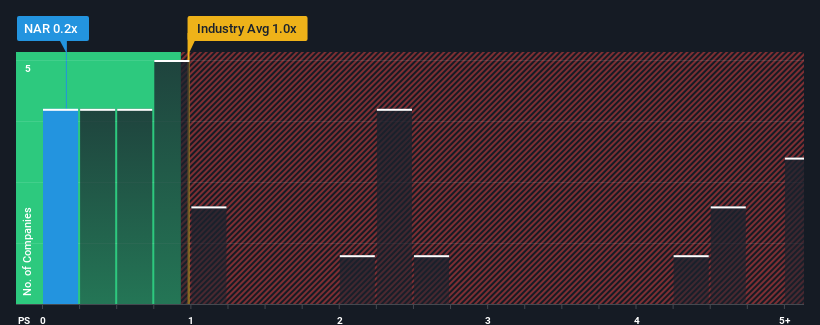
Following the heavy fall in price, Northamber may be sending buy signals at present with its price-to-sales (or "P/S") ratio of 0.2x, considering almost half of all companies in the Electronic industry in the United Kingdom have P/S ratios greater than 1x and even P/S higher than 3x aren't out of the ordinary. However, the P/S might be low for a reason and it requires further investigation to determine if it's justified.
View our latest analysis for Northamber
How Has Northamber Performed Recently?
For example, consider that Northamber's financial performance has been poor lately as its revenue has been in decline. It might be that many expect the disappointing revenue performance to continue or accelerate, which has repressed the P/S. However, if this doesn't eventuate then existing shareholders may be feeling optimistic about the future direction of the share price.
We don't have analyst forecasts, but you can see how recent trends are setting up the company for the future by checking out our free report on Northamber's earnings, revenue and cash flow.Do Revenue Forecasts Match The Low P/S Ratio?
There's an inherent assumption that a company should underperform the industry for P/S ratios like Northamber's to be considered reasonable.
In reviewing the last year of financials, we were disheartened to see the company's revenues fell to the tune of 7.2%. That put a dampener on the good run it was having over the longer-term as its three-year revenue growth is still a noteworthy 12% in total. Although it's been a bumpy ride, it's still fair to say the revenue growth recently has been mostly respectable for the company.
Weighing that recent medium-term revenue trajectory against the broader industry's one-year forecast for expansion of 4.1% shows it's about the same on an annualised basis.
With this in consideration, we find it intriguing that Northamber's P/S falls short of its industry peers. Apparently some shareholders are more bearish than recent times would indicate and have been accepting lower selling prices.
What We Can Learn From Northamber's P/S?
Northamber's recently weak share price has pulled its P/S back below other Electronic companies. Typically, we'd caution against reading too much into price-to-sales ratios when settling on investment decisions, though it can reveal plenty about what other market participants think about the company.
The fact that Northamber currently trades at a low P/S relative to the industry is unexpected considering its recent three-year growth is in line with the wider industry forecast. When we see industry-like revenue growth but a lower than expected P/S, we assume potential risks are what might be placing downward pressure on the share price. At least the risk of a price drop looks to be subdued if recent medium-term revenue trends continue, but investors seem to think future revenue could see some volatility.
And what about other risks? Every company has them, and we've spotted 2 warning signs for Northamber (of which 1 shouldn't be ignored!) you should know about.
Of course, profitable companies with a history of great earnings growth are generally safer bets. So you may wish to see this free collection of other companies that have reasonable P/E ratios and have grown earnings strongly.
Valuation is complex, but we're here to simplify it.
Discover if Northamber might be undervalued or overvalued with our detailed analysis, featuring fair value estimates, potential risks, dividends, insider trades, and its financial condition.
Access Free AnalysisHave feedback on this article? Concerned about the content? Get in touch with us directly. Alternatively, email editorial-team (at) simplywallst.com.
This article by Simply Wall St is general in nature. We provide commentary based on historical data and analyst forecasts only using an unbiased methodology and our articles are not intended to be financial advice. It does not constitute a recommendation to buy or sell any stock, and does not take account of your objectives, or your financial situation. We aim to bring you long-term focused analysis driven by fundamental data. Note that our analysis may not factor in the latest price-sensitive company announcements or qualitative material. Simply Wall St has no position in any stocks mentioned.
About AIM:NAR
Northamber
Engages in the supply of computer hardware, computer printers and peripheral products, computer telephony products, and other electronic transmission equipment in the United Kingdom.
Flawless balance sheet and good value.
Market Insights

Advertisement
Community Narratives
MicroVision will explode future revenue by 380.37% with a vision towards success
Fair Value US$60.00|98.4% undervalued
TH
Community Contributor
The Indispensable Artery for a New North American Economy
Fair Value CA$132.87|1.3% undervalued
TI
Community Contributor