- United Kingdom
- /
- Software
- /
- AIM:OMG
Oxford Metrics plc's (LON:OMG) 26% Share Price Plunge Could Signal Some Risk
Unfortunately for some shareholders, the Oxford Metrics plc (LON:OMG) share price has dived 26% in the last thirty days, prolonging recent pain. Instead of being rewarded, shareholders who have already held through the last twelve months are now sitting on a 33% share price drop.
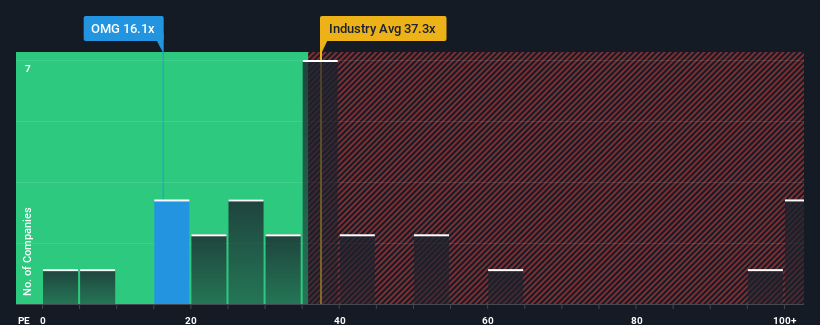
Although its price has dipped substantially, it's still not a stretch to say that Oxford Metrics' price-to-earnings (or "P/E") ratio of 16.1x right now seems quite "middle-of-the-road" compared to the market in the United Kingdom, where the median P/E ratio is around 17x. However, investors might be overlooking a clear opportunity or potential setback if there is no rational basis for the P/E.
Oxford Metrics hasn't been tracking well recently as its declining earnings compare poorly to other companies, which have seen some growth on average. It might be that many expect the dour earnings performance to strengthen positively, which has kept the P/E from falling. You'd really hope so, otherwise you're paying a relatively elevated price for a company with this sort of growth profile.
View our latest analysis for Oxford Metrics

What Are Growth Metrics Telling Us About The P/E?
The only time you'd be comfortable seeing a P/E like Oxford Metrics' is when the company's growth is tracking the market closely.
Taking a look back first, the company's earnings per share growth last year wasn't something to get excited about as it posted a disappointing decline of 15%. Still, the latest three year period has seen an excellent 64% overall rise in EPS, in spite of its unsatisfying short-term performance. Accordingly, while they would have preferred to keep the run going, shareholders would probably welcome the medium-term rates of earnings growth.
Looking ahead now, EPS is anticipated to slump, contracting by 6.8% each year during the coming three years according to the three analysts following the company. Meanwhile, the broader market is forecast to expand by 15% each year, which paints a poor picture.
In light of this, it's somewhat alarming that Oxford Metrics' P/E sits in line with the majority of other companies. It seems most investors are hoping for a turnaround in the company's business prospects, but the analyst cohort is not so confident this will happen. Only the boldest would assume these prices are sustainable as these declining earnings are likely to weigh on the share price eventually.
The Bottom Line On Oxford Metrics' P/E
Oxford Metrics' plummeting stock price has brought its P/E right back to the rest of the market. While the price-to-earnings ratio shouldn't be the defining factor in whether you buy a stock or not, it's quite a capable barometer of earnings expectations.
Our examination of Oxford Metrics' analyst forecasts revealed that its outlook for shrinking earnings isn't impacting its P/E as much as we would have predicted. Right now we are uncomfortable with the P/E as the predicted future earnings are unlikely to support a more positive sentiment for long. This places shareholders' investments at risk and potential investors in danger of paying an unnecessary premium.
Don't forget that there may be other risks. For instance, we've identified 3 warning signs for Oxford Metrics (1 shouldn't be ignored) you should be aware of.
If these risks are making you reconsider your opinion on Oxford Metrics, explore our interactive list of high quality stocks to get an idea of what else is out there.
New: AI Stock Screener & Alerts
Our new AI Stock Screener scans the market every day to uncover opportunities.
• Dividend Powerhouses (3%+ Yield)
• Undervalued Small Caps with Insider Buying
• High growth Tech and AI Companies
Or build your own from over 50 metrics.
Have feedback on this article? Concerned about the content? Get in touch with us directly. Alternatively, email editorial-team (at) simplywallst.com.
This article by Simply Wall St is general in nature. We provide commentary based on historical data and analyst forecasts only using an unbiased methodology and our articles are not intended to be financial advice. It does not constitute a recommendation to buy or sell any stock, and does not take account of your objectives, or your financial situation. We aim to bring you long-term focused analysis driven by fundamental data. Note that our analysis may not factor in the latest price-sensitive company announcements or qualitative material. Simply Wall St has no position in any stocks mentioned.
About AIM:OMG
Oxford Metrics
Operates as a smart sensing and software company in the United Kingdom.
Flawless balance sheet, undervalued and pays a dividend.
Market Insights
Community Narratives


