
Advertisement
- United Kingdom
- /
- Software
- /
- AIM:OMG
Impressive Earnings May Not Tell The Whole Story For Oxford Metrics (LON:OMG)
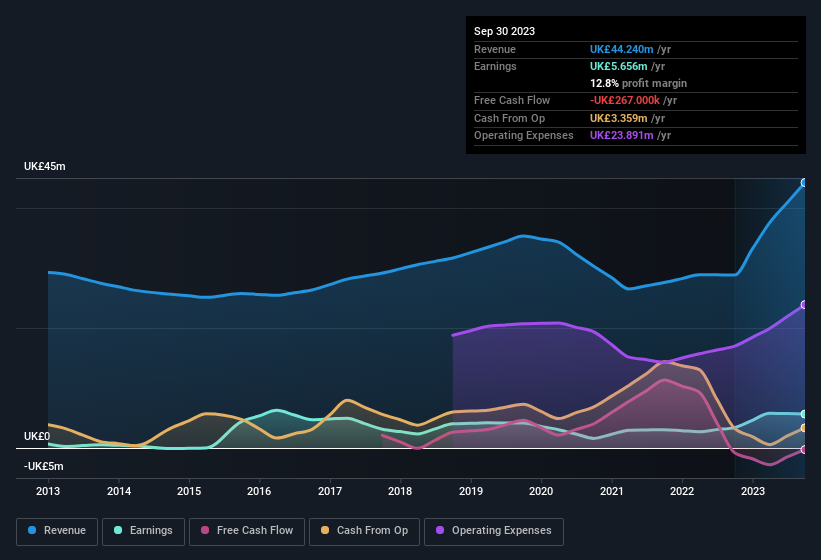
Unsurprisingly, Oxford Metrics plc's (LON:OMG) stock price was strong on the back of its healthy earnings report. However, we think that shareholders may be missing some concerning details in the numbers.
View our latest analysis for Oxford Metrics
A Closer Look At Oxford Metrics' Earnings
Many investors haven't heard of the accrual ratio from cashflow, but it is actually a useful measure of how well a company's profit is backed up by free cash flow (FCF) during a given period. The accrual ratio subtracts the FCF from the profit for a given period, and divides the result by the average operating assets of the company over that time. This ratio tells us how much of a company's profit is not backed by free cashflow.
That means a negative accrual ratio is a good thing, because it shows that the company is bringing in more free cash flow than its profit would suggest. That is not intended to imply we should worry about a positive accrual ratio, but it's worth noting where the accrual ratio is rather high. Notably, there is some academic evidence that suggests that a high accrual ratio is a bad sign for near-term profits, generally speaking.
Over the twelve months to September 2023, Oxford Metrics recorded an accrual ratio of 0.44. As a general rule, that bodes poorly for future profitability. To wit, the company did not generate one whit of free cashflow in that time. In the last twelve months it actually had negative free cash flow, with an outflow of UK£267k despite its profit of UK£5.66m, mentioned above. Coming off the back of negative free cash flow last year, we imagine some shareholders might wonder if its cash burn of UK£267k, this year, indicates high risk.
That might leave you wondering what analysts are forecasting in terms of future profitability. Luckily, you can click here to see an interactive graph depicting future profitability, based on their estimates.
Our Take On Oxford Metrics' Profit Performance
As we discussed above, we think Oxford Metrics' earnings were not supported by free cash flow, which might concern some investors. For this reason, we think that Oxford Metrics' statutory profits may be a bad guide to its underlying earnings power, and might give investors an overly positive impression of the company. But on the bright side, its earnings per share have grown at an extremely impressive rate over the last three years. Of course, we've only just scratched the surface when it comes to analysing its earnings; one could also consider margins, forecast growth, and return on investment, among other factors. So if you'd like to dive deeper into this stock, it's crucial to consider any risks it's facing. Our analysis shows 2 warning signs for Oxford Metrics (1 is potentially serious!) and we strongly recommend you look at these before investing.
Today we've zoomed in on a single data point to better understand the nature of Oxford Metrics' profit. But there are plenty of other ways to inform your opinion of a company. Some people consider a high return on equity to be a good sign of a quality business. While it might take a little research on your behalf, you may find this free collection of companies boasting high return on equity, or this list of stocks that insiders are buying to be useful.
New: AI Stock Screener & Alerts
Our new AI Stock Screener scans the market every day to uncover opportunities.
• Dividend Powerhouses (3%+ Yield)
• Undervalued Small Caps with Insider Buying
• High growth Tech and AI Companies
Or build your own from over 50 metrics.
Have feedback on this article? Concerned about the content? Get in touch with us directly. Alternatively, email editorial-team (at) simplywallst.com.
This article by Simply Wall St is general in nature. We provide commentary based on historical data and analyst forecasts only using an unbiased methodology and our articles are not intended to be financial advice. It does not constitute a recommendation to buy or sell any stock, and does not take account of your objectives, or your financial situation. We aim to bring you long-term focused analysis driven by fundamental data. Note that our analysis may not factor in the latest price-sensitive company announcements or qualitative material. Simply Wall St has no position in any stocks mentioned.
About AIM:OMG
Oxford Metrics
Operates as a smart sensing and software company in the United Kingdom.
Flawless balance sheet, undervalued and pays a dividend.
Market Insights

Advertisement
Community Narratives
The "Molecular Pencil": Why Beam's Technology is Built to Win
Fair Value US$65.01|65.4% undervalued
DA
Community Contributor
The silent giant behind virtually every advanced chip powering AI, smartphones, and modern infrastructure.
Fair Value US$310.00|6.1% undervalued
OS
Community Contributor
ADP Stock: Solid Fundamentals, But AI Investments Test Its Margin Resilience
Fair Value US$387.77|34.2% undervalued
YI
Community Contributor
MINISO's fair value is projected at 26.69 with an anticipated PE ratio shift of 20x
Fair Value US$24.03|9.6% undervalued
BE
Community Contributor