
Advertisement
- United Kingdom
- /
- Software
- /
- AIM:FDP
FD Technologies' (LON:FDP) Returns On Capital Not Reflecting Well On The Business
If we want to find a stock that could multiply over the long term, what are the underlying trends we should look for? In a perfect world, we'd like to see a company investing more capital into its business and ideally the returns earned from that capital are also increasing. This shows us that it's a compounding machine, able to continually reinvest its earnings back into the business and generate higher returns. In light of that, when we looked at FD Technologies (LON:FDP) and its ROCE trend, we weren't exactly thrilled.
What Is Return On Capital Employed (ROCE)?
Just to clarify if you're unsure, ROCE is a metric for evaluating how much pre-tax income (in percentage terms) a company earns on the capital invested in its business. The formula for this calculation on FD Technologies is:
Return on Capital Employed = Earnings Before Interest and Tax (EBIT) ÷ (Total Assets - Current Liabilities)
0.015 = UK£4.4m ÷ (UK£374m - UK£82m) (Based on the trailing twelve months to August 2022).
So, FD Technologies has an ROCE of 1.5%. In absolute terms, that's a low return and it also under-performs the Software industry average of 7.9%.
Our analysis indicates that FDP is potentially overvalued!
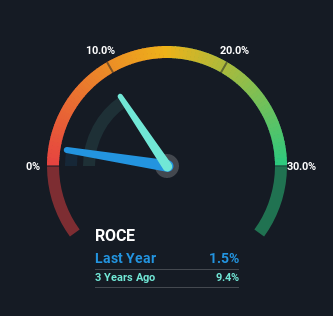
In the above chart we have measured FD Technologies' prior ROCE against its prior performance, but the future is arguably more important. If you'd like, you can check out the forecasts from the analysts covering FD Technologies here for free.
How Are Returns Trending?
In terms of FD Technologies' historical ROCE movements, the trend isn't fantastic. Around five years ago the returns on capital were 7.6%, but since then they've fallen to 1.5%. However, given capital employed and revenue have both increased it appears that the business is currently pursuing growth, at the consequence of short term returns. If these investments prove successful, this can bode very well for long term stock performance.
The Bottom Line On FD Technologies' ROCE
Even though returns on capital have fallen in the short term, we find it promising that revenue and capital employed have both increased for FD Technologies. These growth trends haven't led to growth returns though, since the stock has fallen 61% over the last five years. As a result, we'd recommend researching this stock further to uncover what other fundamentals of the business can show us.
Like most companies, FD Technologies does come with some risks, and we've found 1 warning sign that you should be aware of.
While FD Technologies isn't earning the highest return, check out this free list of companies that are earning high returns on equity with solid balance sheets.
New: AI Stock Screener & Alerts
Our new AI Stock Screener scans the market every day to uncover opportunities.
• Dividend Powerhouses (3%+ Yield)
• Undervalued Small Caps with Insider Buying
• High growth Tech and AI Companies
Or build your own from over 50 metrics.
Have feedback on this article? Concerned about the content? Get in touch with us directly. Alternatively, email editorial-team (at) simplywallst.com.
This article by Simply Wall St is general in nature. We provide commentary based on historical data and analyst forecasts only using an unbiased methodology and our articles are not intended to be financial advice. It does not constitute a recommendation to buy or sell any stock, and does not take account of your objectives, or your financial situation. We aim to bring you long-term focused analysis driven by fundamental data. Note that our analysis may not factor in the latest price-sensitive company announcements or qualitative material. Simply Wall St has no position in any stocks mentioned.
MI

The Foxhole
Druckenmiller says cheap money's days are numbered. Boring, self-funding companies could be the opportunity.
1311
DE
devon_jd150
Leverage on its own is close to useless as a screen right now, because so much corporate debt was termed out at 2 to 3% and has not repriced. A business at three times leverage with nothing due until 2031 is in a completely different position from the same ratio rolling next year. Screen on weighted average maturity and the schedule behind it.
LE
LeverageIsLovely
In my view, Insurance companies are best positioned for this.
 Mitchell Lawler
Market Insights
Which payment stocks actually get paid?

Every new payment app was supposed to kill Visa and Mastercard. Instead, they got bigger. So what does that mean for the payment stocks on your radar?
32
About AIM:FDP
FD Technologies
Provides software and consulting services in the United Kingdom and internationally.
Flawless balance sheet with concerning outlook.
Similar Companies
Market Insights


Advertisement
Weekly Picks
RI


Rick_Orford on Starfighters Space ·
The 1960s Fighter Jet That Could Crack Open a $20 Billion Satellite Market
Fair Value:US$522.8% undervalued
67 followersusers have followed this narrative
4 commentsusers have commented on this narrative
11 likesusers have liked this narrative
TR


tripledub on Meta Platforms ·
The $135 Billion Bet That Should Make Every Shareholder Nervous
Fair Value:US$5862.7% undervalued
48 followersusers have followed this narrative
3 commentsusers have commented on this narrative
34 likesusers have liked this narrative
TA


Talos on Voyager Technologies ·
The "Landlord of Orbit" – A Deep Value Play Ahead of the Starlab Era
Fair Value:US$385.291.0% undervalued
31 followersusers have followed this narrative
0 commentsusers have commented on this narrative
5 likesusers have liked this narrative
IV

Ivoed on Uber Technologies ·
Uber’s Valuation Depends On Who Captures The Economics Of Driverless Rides
Fair Value:US$11630.7% undervalued
7 followersusers have followed this narrative
0 commentsusers have commented on this narrative
3 likesusers have liked this narrative
Recently Updated Narratives
WO


woodworthfund on Kraft Heinz ·
Kraft Heinz (KHC): Less Drama, More Ketchup
Fair Value:US$3527.7% undervalued
27 followersusers have followed this narrative
0 commentsusers have commented on this narrative
0 likesusers have liked this narrative
LU


LunaRodas on DICK'S Sporting Goods ·
DKS | DICK'S Sporting Goods: What They Said vs. What They Did
Fair Value:US$112.7710.2% overvalued
1 followerusers have followed this narrative
0 commentsusers have commented on this narrative
0 likesusers have liked this narrative
PR


prajeeshprathap on Medpace Holdings ·
Why Medpace Outperforms Competitors in the Mid-Sized Biotech Niche
Fair Value:US$53614.6% overvalued
1 followerusers have followed this narrative
0 commentsusers have commented on this narrative
0 likesusers have liked this narrative
Popular Narratives
OS


oscargarcia on NVIDIA ·
The company that went from selling GPUs to gamers to becoming the AI arms dealer of the 21st century.
Fair Value:US$28023.9% undervalued
355 followersusers have followed this narrative
9 commentsusers have commented on this narrative
16 likesusers have liked this narrative
CU

CubanEros on Microsoft ·
A wonderful business at reasonable price.
Fair Value:US$419.9117.1% overvalued
204 followersusers have followed this narrative
0 commentsusers have commented on this narrative
9 likesusers have liked this narrative
KI

KiwiInvest on Amazon.com ·
Amazon's high growth, high tech segments propel its profits, while traditional segments plod along
Fair Value:US$475.0945.1% undervalued
228 followersusers have followed this narrative
1 commentusers have commented on this narrative
8 likesusers have liked this narrative
Trending Discussion


JO
johnk72 on Global X AI Infrastructure ETF ·
Great picks & shovels investment. I hold 3,000 units with a plan to hold until the end of 2028
2
|0