
Advertisement
- United Kingdom
- /
- Software
- /
- AIM:CER
Is Cerillion Plc's (LON:CER) Recent Stock Performance Tethered To Its Strong Fundamentals?
Cerillion (LON:CER) has had a great run on the share market with its stock up by a significant 19% over the last three months. Given that the market rewards strong financials in the long-term, we wonder if that is the case in this instance. Particularly, we will be paying attention to Cerillion's ROE today.
Return on equity or ROE is an important factor to be considered by a shareholder because it tells them how effectively their capital is being reinvested. In other words, it is a profitability ratio which measures the rate of return on the capital provided by the company's shareholders.
Check out our latest analysis for Cerillion
How Do You Calculate Return On Equity?
The formula for ROE is:
Return on Equity = Net Profit (from continuing operations) ÷ Shareholders' Equity
So, based on the above formula, the ROE for Cerillion is:
35% = UK£13m ÷ UK£37m (Based on the trailing twelve months to September 2023).
The 'return' is the yearly profit. That means that for every £1 worth of shareholders' equity, the company generated £0.35 in profit.
What Is The Relationship Between ROE And Earnings Growth?
We have already established that ROE serves as an efficient profit-generating gauge for a company's future earnings. We now need to evaluate how much profit the company reinvests or "retains" for future growth which then gives us an idea about the growth potential of the company. Assuming all else is equal, companies that have both a higher return on equity and higher profit retention are usually the ones that have a higher growth rate when compared to companies that don't have the same features.
A Side By Side comparison of Cerillion's Earnings Growth And 35% ROE
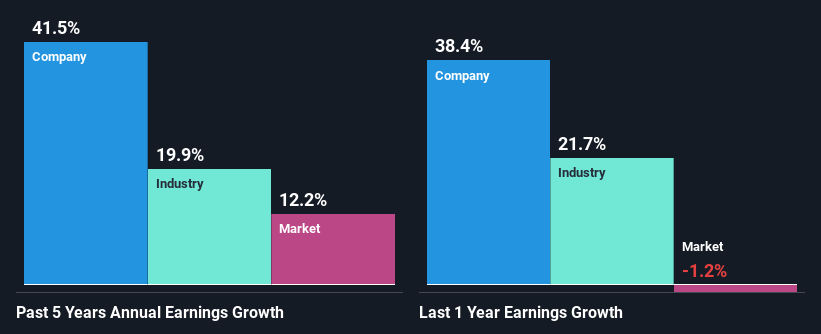
Firstly, we acknowledge that Cerillion has a significantly high ROE. Second, a comparison with the average ROE reported by the industry of 8.5% also doesn't go unnoticed by us. So, the substantial 42% net income growth seen by Cerillion over the past five years isn't overly surprising.
Next, on comparing with the industry net income growth, we found that Cerillion's growth is quite high when compared to the industry average growth of 20% in the same period, which is great to see.
Earnings growth is a huge factor in stock valuation. The investor should try to establish if the expected growth or decline in earnings, whichever the case may be, is priced in. This then helps them determine if the stock is placed for a bright or bleak future. One good indicator of expected earnings growth is the P/E ratio which determines the price the market is willing to pay for a stock based on its earnings prospects. So, you may want to check if Cerillion is trading on a high P/E or a low P/E, relative to its industry.
Is Cerillion Efficiently Re-investing Its Profits?
The three-year median payout ratio for Cerillion is 29%, which is moderately low. The company is retaining the remaining 71%. By the looks of it, the dividend is well covered and Cerillion is reinvesting its profits efficiently as evidenced by its exceptional growth which we discussed above.
Besides, Cerillion has been paying dividends over a period of eight years. This shows that the company is committed to sharing profits with its shareholders. Upon studying the latest analysts' consensus data, we found that the company is expected to keep paying out approximately 24% of its profits over the next three years. As a result, Cerillion's ROE is not expected to change by much either, which we inferred from the analyst estimate of 30% for future ROE.
Conclusion
Overall, we are quite pleased with Cerillion's performance. Particularly, we like that the company is reinvesting heavily into its business, and at a high rate of return. Unsurprisingly, this has led to an impressive earnings growth. With that said, the latest industry analyst forecasts reveal that the company's earnings growth is expected to slow down. To know more about the company's future earnings growth forecasts take a look at this free report on analyst forecasts for the company to find out more.
New: AI Stock Screener & Alerts
Our new AI Stock Screener scans the market every day to uncover opportunities.
• Dividend Powerhouses (3%+ Yield)
• Undervalued Small Caps with Insider Buying
• High growth Tech and AI Companies
Or build your own from over 50 metrics.
Have feedback on this article? Concerned about the content? Get in touch with us directly. Alternatively, email editorial-team (at) simplywallst.com.
This article by Simply Wall St is general in nature. We provide commentary based on historical data and analyst forecasts only using an unbiased methodology and our articles are not intended to be financial advice. It does not constitute a recommendation to buy or sell any stock, and does not take account of your objectives, or your financial situation. We aim to bring you long-term focused analysis driven by fundamental data. Note that our analysis may not factor in the latest price-sensitive company announcements or qualitative material. Simply Wall St has no position in any stocks mentioned.
About AIM:CER
Cerillion
Provides software for billing, charging, and customer relationship management (CRM) to the telecommunications sector in the United Kingdom, Europe, the Middle East, the Americas, and the Asia Pacific.
Flawless balance sheet and good value.
Similar Companies
Market Insights

Advertisement
Community Narratives
Finding The True Value Of A Logistics Powerhouse
Fair Value US$95.21|6.3% undervalued
NV
Community Contributor
Paradigm Biopharmaceuticals Will Lead Osteoarthritis Treatment with Zilosul's FDA Success
Fair Value AU$5.50|91.9% undervalued
AM
Community Contributor
Barrick Mining (ABX:CA): A Gold Hedge against a U.S. Shutdown
Fair Value CA$60.00|25.8% undervalued
GM
Community Contributor