- United Kingdom
- /
- Software
- /
- AIM:AOM
Subdued Growth No Barrier To ActiveOps Plc (LON:AOM) With Shares Advancing 30%

ActiveOps Plc (LON:AOM) shareholders have had their patience rewarded with a 30% share price jump in the last month. Looking further back, the 20% rise over the last twelve months isn't too bad notwithstanding the strength over the last 30 days.
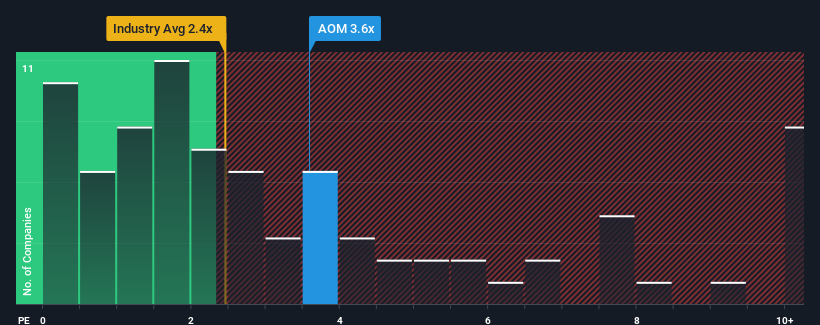
Following the firm bounce in price, when almost half of the companies in the United Kingdom's Software industry have price-to-sales ratios (or "P/S") below 2.4x, you may consider ActiveOps as a stock probably not worth researching with its 3.6x P/S ratio. However, the P/S might be high for a reason and it requires further investigation to determine if it's justified.
See our latest analysis for ActiveOps
What Does ActiveOps' Recent Performance Look Like?
With revenue growth that's inferior to most other companies of late, ActiveOps has been relatively sluggish. One possibility is that the P/S ratio is high because investors think this lacklustre revenue performance will improve markedly. You'd really hope so, otherwise you're paying a pretty hefty price for no particular reason.
Keen to find out how analysts think ActiveOps' future stacks up against the industry? In that case, our free report is a great place to start.Is There Enough Revenue Growth Forecasted For ActiveOps?
ActiveOps' P/S ratio would be typical for a company that's expected to deliver solid growth, and importantly, perform better than the industry.
Taking a look back first, we see that the company managed to grow revenues by a handy 5.2% last year. The latest three year period has also seen an excellent 31% overall rise in revenue, aided somewhat by its short-term performance. So we can start by confirming that the company has done a great job of growing revenues over that time.
Looking ahead now, revenue is anticipated to climb by 8.7% per year during the coming three years according to the three analysts following the company. With the industry predicted to deliver 12% growth per annum, the company is positioned for a weaker revenue result.
With this in consideration, we believe it doesn't make sense that ActiveOps' P/S is outpacing its industry peers. Apparently many investors in the company are way more bullish than analysts indicate and aren't willing to let go of their stock at any price. Only the boldest would assume these prices are sustainable as this level of revenue growth is likely to weigh heavily on the share price eventually.
What We Can Learn From ActiveOps' P/S?
ActiveOps' P/S is on the rise since its shares have risen strongly. It's argued the price-to-sales ratio is an inferior measure of value within certain industries, but it can be a powerful business sentiment indicator.
We've concluded that ActiveOps currently trades on a much higher than expected P/S since its forecast growth is lower than the wider industry. The weakness in the company's revenue estimate doesn't bode well for the elevated P/S, which could take a fall if the revenue sentiment doesn't improve. This places shareholders' investments at significant risk and potential investors in danger of paying an excessive premium.
And what about other risks? Every company has them, and we've spotted 1 warning sign for ActiveOps you should know about.
It's important to make sure you look for a great company, not just the first idea you come across. So if growing profitability aligns with your idea of a great company, take a peek at this free list of interesting companies with strong recent earnings growth (and a low P/E).
Mobile Infrastructure for Defense and Disaster
The next wave in robotics isn't humanoid. Its fully autonomous towers delivering 5G, ISR, and radar in under 30 minutes, anywhere.
Get the investor briefing before the next round of contracts
Sponsored On Behalf of CiTechNew: Manage All Your Stock Portfolios in One Place
We've created the ultimate portfolio companion for stock investors, and it's free.
• Connect an unlimited number of Portfolios and see your total in one currency
• Be alerted to new Warning Signs or Risks via email or mobile
• Track the Fair Value of your stocks
Have feedback on this article? Concerned about the content? Get in touch with us directly. Alternatively, email editorial-team (at) simplywallst.com.
This article by Simply Wall St is general in nature. We provide commentary based on historical data and analyst forecasts only using an unbiased methodology and our articles are not intended to be financial advice. It does not constitute a recommendation to buy or sell any stock, and does not take account of your objectives, or your financial situation. We aim to bring you long-term focused analysis driven by fundamental data. Note that our analysis may not factor in the latest price-sensitive company announcements or qualitative material. Simply Wall St has no position in any stocks mentioned.
Have feedback on this article? Concerned about the content? Get in touch with us directly. Alternatively, email editorial-team@simplywallst.com
About AIM:AOM
ActiveOps
Engages in the provision of hosted operations management software as a service solution to industries in Europe, the Middle East, India, Africa, North America, and Asia Pacific.
High growth potential with excellent balance sheet.
Market Insights

Weekly Picks

Early mover in a fast growing industry. Likely to experience share price volatility as they scale


A case for CA$31.80 (undiluted), aka 8,616% upside from CA$0.37 (an 86 bagger!).


Moderation and Stabilisation: HOLD: Fair Price based on a 4-year Cycle is $12.08
Recently Updated Narratives


An amazing opportunity to potentially get a 100 bagger

Amazon: Why the World’s Biggest Platform Still Runs on Invisible Economics

Sunrun Stock: When the Energy Transition Collides With the Cost of Capital
Popular Narratives


MicroVision will explode future revenue by 380.37% with a vision towards success


Crazy Undervalued 42 Baggers Silver Play (Active & Running Mine)


NVDA: Expanding AI Demand Will Drive Major Data Center Investments Through 2026
Trending Discussion
