Stock Analysis
- United Kingdom
- /
- Specialty Stores
- /
- LSE:TPT
Topps Tiles (LON:TPT) investors are up 12% in the past week, but earnings have declined over the last year

These days it's easy to simply buy an index fund, and your returns should (roughly) match the market. But one can do better than that by picking better than average stocks (as part of a diversified portfolio). To wit, the Topps Tiles Plc (LON:TPT) share price is 41% higher than it was a year ago, much better than the market return of around 0.2% (not including dividends) in the same period. If it can keep that out-performance up over the long term, investors will do very well! The longer term returns have not been as good, with the stock price only 28% higher than it was three years ago.
The past week has proven to be lucrative for Topps Tiles investors, so let's see if fundamentals drove the company's one-year performance.
View our latest analysis for Topps Tiles
While the efficient markets hypothesis continues to be taught by some, it has been proven that markets are over-reactive dynamic systems, and investors are not always rational. One flawed but reasonable way to assess how sentiment around a company has changed is to compare the earnings per share (EPS) with the share price.
During the last year, Topps Tiles actually saw its earnings per share drop 55%.
Given the share price gain, we doubt the market is measuring progress with EPS. Since the change in EPS doesn't seem to correlate with the change in share price, it's worth taking a look at other metrics.
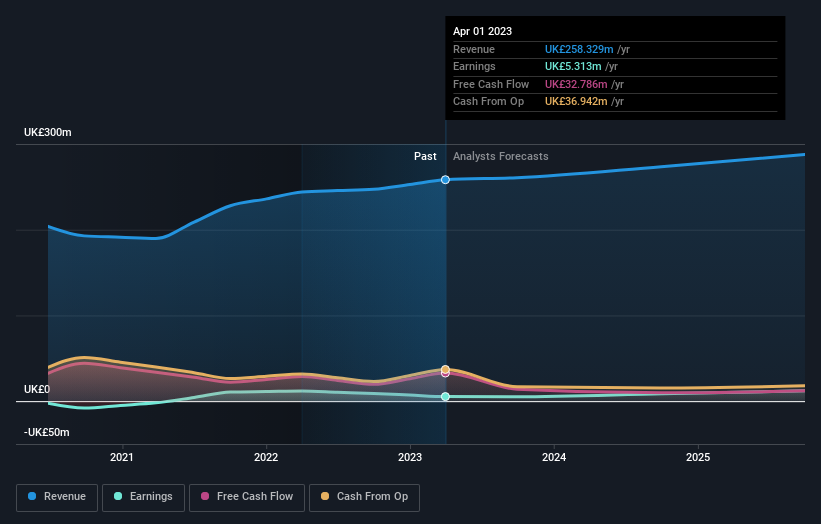
For starters, we suspect the share price has been buoyed by the dividend, which was increased during the year. Income-seeking investors probably helped bid up the stock price. Furthermore, the revenue growth of 5.9% probably also encouraged buyers.
The company's revenue and earnings (over time) are depicted in the image below (click to see the exact numbers).
If you are thinking of buying or selling Topps Tiles stock, you should check out this FREE detailed report on its balance sheet.
What About Dividends?
When looking at investment returns, it is important to consider the difference between total shareholder return (TSR) and share price return. The TSR incorporates the value of any spin-offs or discounted capital raisings, along with any dividends, based on the assumption that the dividends are reinvested. It's fair to say that the TSR gives a more complete picture for stocks that pay a dividend. In the case of Topps Tiles, it has a TSR of 52% for the last 1 year. That exceeds its share price return that we previously mentioned. And there's no prize for guessing that the dividend payments largely explain the divergence!
A Different Perspective
It's nice to see that Topps Tiles shareholders have received a total shareholder return of 52% over the last year. Of course, that includes the dividend. That gain is better than the annual TSR over five years, which is 3%. Therefore it seems like sentiment around the company has been positive lately. Someone with an optimistic perspective could view the recent improvement in TSR as indicating that the business itself is getting better with time. It's always interesting to track share price performance over the longer term. But to understand Topps Tiles better, we need to consider many other factors. Even so, be aware that Topps Tiles is showing 2 warning signs in our investment analysis , you should know about...
We will like Topps Tiles better if we see some big insider buys. While we wait, check out this free list of growing companies with considerable, recent, insider buying.
Please note, the market returns quoted in this article reflect the market weighted average returns of stocks that currently trade on British exchanges.
Valuation is complex, but we're helping make it simple.
Find out whether Topps Tiles is potentially over or undervalued by checking out our comprehensive analysis, which includes fair value estimates, risks and warnings, dividends, insider transactions and financial health.
View the Free AnalysisHave feedback on this article? Concerned about the content? Get in touch with us directly. Alternatively, email editorial-team (at) simplywallst.com.
This article by Simply Wall St is general in nature. We provide commentary based on historical data and analyst forecasts only using an unbiased methodology and our articles are not intended to be financial advice. It does not constitute a recommendation to buy or sell any stock, and does not take account of your objectives, or your financial situation. We aim to bring you long-term focused analysis driven by fundamental data. Note that our analysis may not factor in the latest price-sensitive company announcements or qualitative material. Simply Wall St has no position in any stocks mentioned.
About LSE:TPT
Topps Tiles
Engages in the retail and wholesale distribution of ceramic and porcelain tiles, natural stone, and related products for residential and commercial markets in the United Kingdom.
Undervalued with adequate balance sheet and pays a dividend.
