
Advertisement
Is Marks and Spencer Group plc (LON:MKS) At Risk Of Cutting Its Dividend?
Dividend paying stocks like Marks and Spencer Group plc (LON:MKS) tend to be popular with investors, and for good reason - some research suggests a significant amount of all stock market returns come from reinvested dividends. Yet sometimes, investors buy a popular dividend stock because of its yield, and then lose money if the company's dividend doesn't live up to expectations.
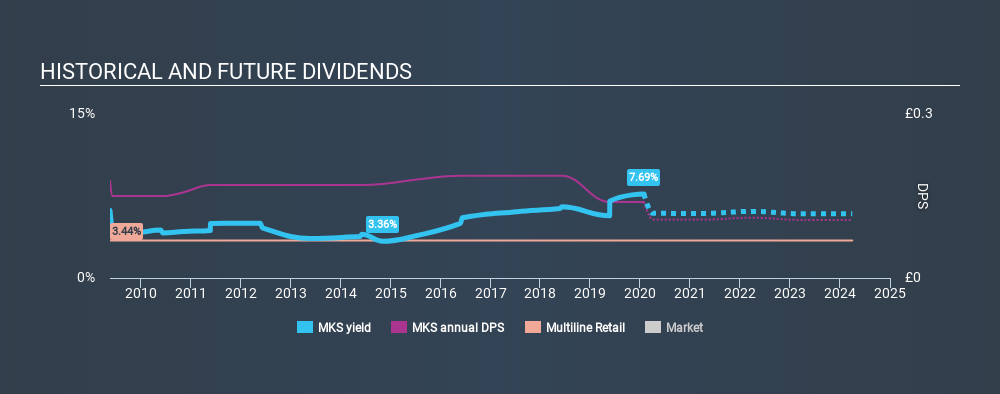
In this case, Marks and Spencer Group likely looks attractive to investors, given its 7.7% dividend yield and a payment history of over ten years. It would not be a surprise to discover that many investors buy it for the dividends. When buying stocks for their dividends, you should always run through the checks below, to see if the dividend looks sustainable.
Click the interactive chart for our full dividend analysis
Payout ratios
Companies (usually) pay dividends out of their earnings. If a company is paying more than it earns, the dividend might have to be cut. As a result, we should always investigate whether a company can afford its dividend, measured as a percentage of a company's net income after tax. In the last year, Marks and Spencer Group paid out 218% of its profit as dividends. A payout ratio above 100% is definitely an item of concern, unless there are some other circumstances that would justify it.
We also measure dividends paid against a company's levered free cash flow, to see if enough cash was generated to cover the dividend. Marks and Spencer Group paid out 55% of its cash flow as dividends last year, which is within a reasonable range for the average corporation. It's good to see that while Marks and Spencer Group's dividends were not covered by profits, at least they are affordable from a cash perspective. If executives were to continue paying more in dividends than the company reported in profits, we'd view this as a warning sign. Extraordinarily few companies are capable of persistently paying a dividend that is greater than their profits.
Is Marks and Spencer Group's Balance Sheet Risky?
As Marks and Spencer Group's dividend was not well covered by earnings, we need to check its balance sheet for signs of financial distress. A rough way to check this is with these two simple ratios: a) net debt divided by EBITDA (earnings before interest, tax, depreciation and amortisation), and b) net interest cover. Net debt to EBITDA measures total debt load relative to company earnings (lower = less debt), while net interest cover measures the ability to pay interest on the debt (higher = greater ability to pay interest costs). Marks and Spencer Group has net debt of 3.99 times its EBITDA, which is getting towards the limit of most investors' comfort zones. Judicious use of debt can enhance shareholder returns, but also adds to the risk if something goes awry.
Net interest cover can be calculated by dividing earnings before interest and tax (EBIT) by the company's net interest expense. Net interest cover of 8.84 times its interest expense appears reasonable for Marks and Spencer Group, although we're conscious that even high interest cover doesn't make a company bulletproof.
We update our data on Marks and Spencer Group every 24 hours, so you can always get our latest analysis of its financial health, here.
Dividend Volatility
Before buying a stock for its income, we want to see if the dividends have been stable in the past, and if the company has a track record of maintaining its dividend. For the purpose of this article, we only scrutinise the last decade of Marks and Spencer Group's dividend payments. This dividend has been unstable, which we define as having been cut one or more times over this time. During the past ten-year period, the first annual payment was UK£0.18 in 2010, compared to UK£0.14 last year. The dividend has shrunk at around 2.4% a year during that period. Marks and Spencer Group's dividend hasn't shrunk linearly at 2.4% per annum, but the CAGR is a useful estimate of the historical rate of change.
We struggle to make a case for buying Marks and Spencer Group for its dividend, given that payments have shrunk over the past ten years.
Dividend Growth Potential
Given that the dividend has been cut in the past, we need to check if earnings are growing and if that might lead to stronger dividends in the future. Marks and Spencer Group's earnings per share have shrunk at 31% a year over the past five years. With this kind of significant decline, we always wonder what has changed in the business. Dividends are about stability, and Marks and Spencer Group's earnings per share, which support the dividend, have been anything but stable.
We'd also point out that Marks and Spencer Group issued a meaningful number of new shares in the past year. Trying to grow the dividend when issuing new shares reminds us of the ancient Greek tale of Sisyphus - perpetually pushing a boulder uphill. Companies that consistently issue new shares are often suboptimal from a dividend perspective.
Conclusion
Dividend investors should always want to know if a) a company's dividends are affordable, b) if there is a track record of consistent payments, and c) if the dividend is capable of growing. We're not keen on the fact that Marks and Spencer Group paid out such a high percentage of its income, although its cashflow is in better shape. Second, earnings per share have been in decline, and its dividend has been cut at least once in the past. In this analysis, Marks and Spencer Group doesn't shape up too well as a dividend stock. We'd find it hard to look past the flaws, and would not be inclined to think of it as a reliable dividend-payer.
Without at least some growth in earnings per share over time, the dividend will eventually come under pressure either from costs or inflation. Very few businesses see earnings consistently shrink year after year in perpetuity though, and so it might be worth seeing what the 20 analysts we track are forecasting for the future.
Looking for more high-yielding dividend ideas? Try our curated list of dividend stocks with a yield above 3%.
If you spot an error that warrants correction, please contact the editor at editorial-team@simplywallst.com. This article by Simply Wall St is general in nature. It does not constitute a recommendation to buy or sell any stock, and does not take account of your objectives, or your financial situation. Simply Wall St has no position in the stocks mentioned.
We aim to bring you long-term focused research analysis driven by fundamental data. Note that our analysis may not factor in the latest price-sensitive company announcements or qualitative material. Thank you for reading.
About LSE:MKS
Good value with adequate balance sheet.
Similar Companies
Market Insights


Advertisement
Community Narratives
For the Emperor: Why Games Workshop Could Be a Star Investment
Fair Value UK£160.00|0.4% overvalued
RO
Community Contributor
Securitas will boost margins with AI and tech-driven services
Fair Value SEK 260.91|44.5% undervalued
UN
Community Contributor
A Leader in EV Charging with Growth Potential
Fair Value €27.00|17.8% undervalued
TI
Community Contributor