
Advertisement
- United Kingdom
- /
- Office REITs
- /
- LSE:HLCL
Are Helical plc's (LON:HLCL) Mixed Financials The Reason For Its Gloomy Performance on The Stock Market?
Helical (LON:HLCL) has had a rough week with its share price down 8.6%. We, however decided to study the company's financials to determine if they have got anything to do with the price decline. Fundamentals usually dictate market outcomes so it makes sense to study the company's financials. Particularly, we will be paying attention to Helical's ROE today.
Return on equity or ROE is a key measure used to assess how efficiently a company's management is utilizing the company's capital. Simply put, it is used to assess the profitability of a company in relation to its equity capital.
View our latest analysis for Helical
How Do You Calculate Return On Equity?
The formula for return on equity is:
Return on Equity = Net Profit (from continuing operations) ÷ Shareholders' Equity
So, based on the above formula, the ROE for Helical is:
2.9% = UK£18m ÷ UK£608m (Based on the trailing twelve months to March 2021).
The 'return' is the profit over the last twelve months. Another way to think of that is that for every £1 worth of equity, the company was able to earn £0.03 in profit.
What Has ROE Got To Do With Earnings Growth?
So far, we've learned that ROE is a measure of a company's profitability. We now need to evaluate how much profit the company reinvests or "retains" for future growth which then gives us an idea about the growth potential of the company. Assuming all else is equal, companies that have both a higher return on equity and higher profit retention are usually the ones that have a higher growth rate when compared to companies that don't have the same features.
Helical's Earnings Growth And 2.9% ROE
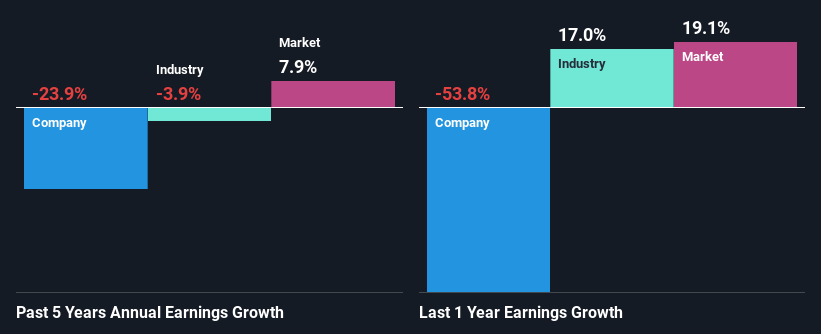
On the face of it, Helical's ROE is not much to talk about. We then compared the company's ROE to the broader industry and were disappointed to see that the ROE is lower than the industry average of 6.3%. Therefore, it might not be wrong to say that the five year net income decline of 24% seen by Helical was probably the result of it having a lower ROE. We reckon that there could also be other factors at play here. For example, it is possible that the business has allocated capital poorly or that the company has a very high payout ratio.
Furthermore, even when compared to the industry, which has been shrinking its earnings at a rate 3.9% in the same period, we found that Helical's performance is pretty disappointing, as it suggests that the company has been shrunk its earnings at a rate faster than the industry.
The basis for attaching value to a company is, to a great extent, tied to its earnings growth. What investors need to determine next is if the expected earnings growth, or the lack of it, is already built into the share price. This then helps them determine if the stock is placed for a bright or bleak future. If you're wondering about Helical's's valuation, check out this gauge of its price-to-earnings ratio, as compared to its industry.
Is Helical Making Efficient Use Of Its Profits?
Looking at its three-year median payout ratio of 33% (or a retention ratio of 67%) which is pretty normal, Helical's declining earnings is rather baffling as one would expect to see a fair bit of growth when a company is retaining a good portion of its profits. So there might be other factors at play here which could potentially be hampering growth. For example, the business has faced some headwinds.
Moreover, Helical has been paying dividends for at least ten years or more suggesting that management must have perceived that the shareholders prefer dividends over earnings growth. Upon studying the latest analysts' consensus data, we found that the company's future payout ratio is expected to rise to 124% over the next three years. Accordingly, the expected increase in the payout ratio explains the expected decline in the company's ROE to 1.6%, over the same period.
Conclusion
In total, we're a bit ambivalent about Helical's performance. Even though it appears to be retaining most of its profits, given the low ROE, investors may not be benefitting from all that reinvestment after all. The low earnings growth suggests our theory correct. That being so, the latest industry analyst forecasts show that the analysts are expecting to see a huge improvement in the company's earnings growth rate. Are these analysts expectations based on the broad expectations for the industry, or on the company's fundamentals? Click here to be taken to our analyst's forecasts page for the company.
When trading Helical or any other investment, use the platform considered by many to be the Professional's Gateway to the Worlds Market, Interactive Brokers. You get the lowest-cost* trading on stocks, options, futures, forex, bonds and funds worldwide from a single integrated account. Promoted
Valuation is complex, but we're here to simplify it.
Discover if Helical might be undervalued or overvalued with our detailed analysis, featuring fair value estimates, potential risks, dividends, insider trades, and its financial condition.
Access Free AnalysisThis article by Simply Wall St is general in nature. We provide commentary based on historical data and analyst forecasts only using an unbiased methodology and our articles are not intended to be financial advice. It does not constitute a recommendation to buy or sell any stock, and does not take account of your objectives, or your financial situation. We aim to bring you long-term focused analysis driven by fundamental data. Note that our analysis may not factor in the latest price-sensitive company announcements or qualitative material. Simply Wall St has no position in any stocks mentioned.
*Interactive Brokers Rated Lowest Cost Broker by StockBrokers.com Annual Online Review 2020
Have feedback on this article? Concerned about the content? Get in touch with us directly. Alternatively, email editorial-team (at) simplywallst.com.
About LSE:HLCL
Helical
Engages in the development, investment, and rental of real estate properties in the United Kingdom.
Fair value with mediocre balance sheet.
Similar Companies
Market Insights

Advertisement
Community Narratives
Kodiak AI - a potential 100 bagger opportunity?
Fair Value US$14.00|44.7% undervalued
DA
Community Contributor
A Fair Price for a Great Business Facing Real Threats
Fair Value US$383.06|13.0% undervalued
IM
Community Contributor
AXON And Shopify Integration Will Unlock Global Mobile Advertising
Fair Value US$646.30|0% overvalued
AN
Based on Analyst Price Targets