
Advertisement
- United Kingdom
- /
- Specialized REITs
- /
- LSE:BYG
Should You Buy Big Yellow Group Plc (LON:BYG) For Its Dividend?

Want to participate in a short research study? Help shape the future of investing tools and you could win a $250 gift card!
Dividend paying stocks like Big Yellow Group Plc (LON:BYG) tend to be popular with investors, and for good reason - some research shows that a significant amount of all stock market returns come from reinvested dividends. Yet sometimes, investors buy a stock for its dividend and lose money because the share price falls by more than they earned in dividend payments.
In this case, Big Yellow Group likely looks attractive to dividend investors, given its 3.2% dividend yield and nine-year payment history. We'd agree the yield does look enticing. When buying stocks for their dividends, you should always run through the checks below, to see if the dividend looks sustainable.
Explore this interactive chart for our latest analysis on Big Yellow Group!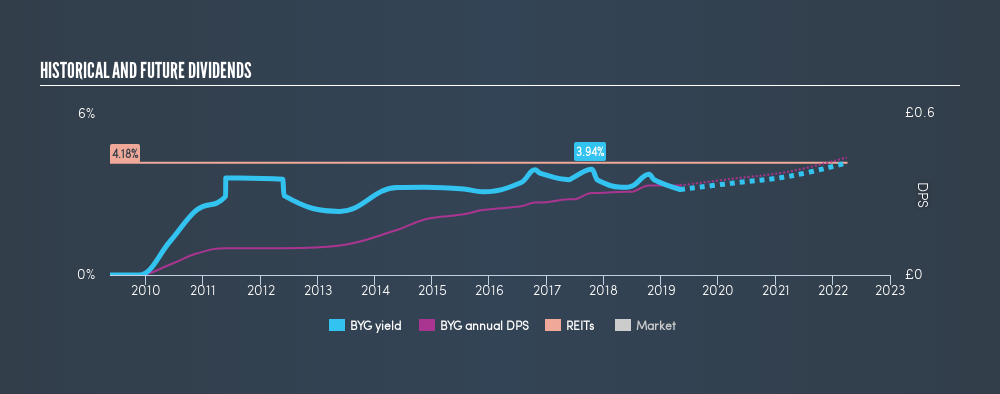
Payout ratios
Dividends are typically paid from company earnings. If a company pays more in dividends than it earned, then the dividend might become unsustainable - hardly an ideal situation. Comparing dividend payments to a company's net profit after tax is a simple way of reality-checking whether a dividend is sustainable. In the last year, Big Yellow Group paid out 72% of its profit as dividends. This is a fairly normal payout ratio among most businesses. It allows a higher dividend to be paid to shareholders, but does limit the capital retained in the business - which could be good or bad.
Another important check we do is to see if the free cash flow generated is sufficient to pay the dividend. Big Yellow Group paid out 68% of its cash flow as dividends last year, which does not seem unusual.
REITs like Big Yellow Group often have different rules governing their distributions, so a higher payout ratio on its own is not unusual.
Is Big Yellow Group's Balance Sheet Risky?
As Big Yellow Group has a meaningful amount of debt, we need to check its balance sheet to see if the company might have debt risks. A rough way to check this is with these two simple ratios: a) net debt divided by EBITDA (earnings before interest, tax, depreciation and amortisation), and b) net interest cover. Net debt to EBITDA is a measure of a company's total debt. Net interest cover measures the ability to meet interest payments on debt. Essentially we check that a) a company does not have too much debt, and b) that it can afford to pay the interest. With net debt of above 3x EBITDA, investors are starting to take on a meaningful amount of risk, should the business enter a downturn.
We calculated its interest cover by measuring its earnings before interest and tax (EBIT), and dividing this by the company's net interest expense. Big Yellow Group has EBIT of 7.63 times its interest expense, which we think is adequate.
Consider getting our latest analysis on Big Yellow Group's financial position here.
Dividend Volatility
One of the major risks of relying on dividend income, is the potential for a company to struggle financially and cut its dividend. Not only is your income cut, but the value of your investment declines as well - nasty. The first recorded dividend for Big Yellow Group, in the last decade, was nine years ago. Its dividend has not fluctuated much that time, which we like, but we're conscious that the company might not yet have a track record of maintaining dividends in all economic conditions. During the past nine-year period, the first annual payment was UK£0.04 in 2010, compared to UK£0.33 last year. This works out to be a compound annual growth rate (CAGR) of approximately 27% a year over that time.
We're not overly excited about the relatively short history of dividend payments, however the dividend is growing at a nice rate and we might take a closer look.
Dividend Growth Potential
The other half of the dividend investing equation is evaluating whether earnings per share (EPS) are growing. Over the long term, dividends need to grow at or above the rate of inflation, in order to maintain the recipient's purchasing power. It's good to see Big Yellow Group has been growing its earnings per share at 25% a year over the past 5 years. Earnings per share are sharply up, but we wonder if paying out more than half its earnings (leaving less for reinvestment) is an implicit signal that Big Yellow Group's growth will be slower in the future.
We'd also point out that Big Yellow Group issued a meaningful number of new shares in the past year. Trying to grow the dividend when issuing new shares reminds us of the ancient Greek tale of Sisyphus - perpetually pushing a boulder uphill. Companies that consistently issue new shares are often suboptimal from a dividend perspective.
Conclusion
To summarise, shareholders should always check that Big Yellow Group's dividends are affordable, that its dividend payments are relatively stable, and that it has decent prospects for growing its earnings and dividend. First, we think Big Yellow Group is paying out an acceptable percentage of its cashflow and profit. Next, earnings growth has been good, but unfortunately the company has not been paying dividends as long as we'd like. In sum, we find it hard to get excited about Big Yellow Group from a dividend perspective. It's not that we think it's a bad business; just that there are other companies that perform better on these criteria.
Earnings growth generally bodes well for the future value of company dividend payments. See if the 9 Big Yellow Group analysts we track are forecasting continued growth with our freereport on analyst estimates for the company.
Looking for more high-yielding dividend ideas? Try our curated list of dividend stocks with a yield above 3%.
We aim to bring you long-term focused research analysis driven by fundamental data. Note that our analysis may not factor in the latest price-sensitive company announcements or qualitative material.
If you spot an error that warrants correction, please contact the editor at editorial-team@simplywallst.com. This article by Simply Wall St is general in nature. It does not constitute a recommendation to buy or sell any stock, and does not take account of your objectives, or your financial situation. Simply Wall St has no position in the stocks mentioned. Thank you for reading.
About LSE:BYG
Very undervalued with adequate balance sheet and pays a dividend.
Similar Companies
Market Insights


Advertisement
Community Narratives
For the Emperor: Why Games Workshop Could Be a Star Investment
Fair Value UK£160.00|0.5% overvalued
RO
Community Contributor
Securitas will boost margins with AI and tech-driven services
Fair Value SEK 260.91|44.9% undervalued
UN
Community Contributor
A Leader in EV Charging with Growth Potential
Fair Value €27.00|21.3% undervalued
TI
Community Contributor