- United Kingdom
- /
- Specialized REITs
- /
- LSE:BYG
Does Big Yellow Group Plc's (LON:BYG) Weak Fundamentals Mean That The Stock Could Move In The Opposite Direction?
Most readers would already know that Big Yellow Group's (LON:BYG) stock increased by 3.5% over the past three months. However, in this article, we decided to focus on its weak financials, as long-term fundamentals ultimately dictate market outcomes. In this article, we decided to focus on Big Yellow Group's ROE.
Return on Equity or ROE is a test of how effectively a company is growing its value and managing investors’ money. Put another way, it reveals the company's success at turning shareholder investments into profits.
View our latest analysis for Big Yellow Group
How Do You Calculate Return On Equity?
ROE can be calculated by using the formula:
Return on Equity = Net Profit (from continuing operations) ÷ Shareholders' Equity
So, based on the above formula, the ROE for Big Yellow Group is:
4.5% = UK£57m ÷ UK£1.3b (Based on the trailing twelve months to September 2020).
The 'return' is the yearly profit. That means that for every £1 worth of shareholders' equity, the company generated £0.04 in profit.
What Has ROE Got To Do With Earnings Growth?
Thus far, we have learned that ROE measures how efficiently a company is generating its profits. Based on how much of its profits the company chooses to reinvest or "retain", we are then able to evaluate a company's future ability to generate profits. Assuming all else is equal, companies that have both a higher return on equity and higher profit retention are usually the ones that have a higher growth rate when compared to companies that don't have the same features.
A Side By Side comparison of Big Yellow Group's Earnings Growth And 4.5% ROE
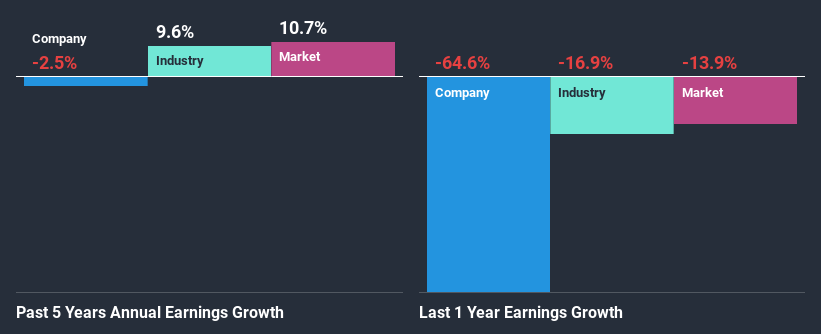
When you first look at it, Big Yellow Group's ROE doesn't look that attractive. Next, when compared to the average industry ROE of 5.7%, the company's ROE leaves us feeling even less enthusiastic. Therefore, it might not be wrong to say that the five year net income decline of 2.5% seen by Big Yellow Group was probably the result of it having a lower ROE. However, there could also be other factors causing the earnings to decline. Such as - low earnings retention or poor allocation of capital.
However, when we compared Big Yellow Group's growth with the industry we found that while the company's earnings have been shrinking, the industry has seen an earnings growth of 9.6% in the same period. This is quite worrisome.

Earnings growth is a huge factor in stock valuation. The investor should try to establish if the expected growth or decline in earnings, whichever the case may be, is priced in. By doing so, they will have an idea if the stock is headed into clear blue waters or if swampy waters await. What is BYG worth today? The intrinsic value infographic in our free research report helps visualize whether BYG is currently mispriced by the market.
Is Big Yellow Group Making Efficient Use Of Its Profits?
Big Yellow Group seems to be paying out most of its income as dividends judging by its three-year median payout ratio of 72% (meaning, the company retains only 28% of profits). However, this is typical for REITs as they are often required by law to distribute most of their earnings. Accordingly, this likely explains why its earnings have been shrinking.
Moreover, Big Yellow Group has been paying dividends for at least ten years or more suggesting that management must have perceived that the shareholders prefer dividends over earnings growth. Our latest analyst data shows that the future payout ratio of the company over the next three years is expected to be approximately 85%. However, Big Yellow Group's ROE is predicted to rise to 5.9% despite there being no anticipated change in its payout ratio.
Conclusion
In total, we would have a hard think before deciding on any investment action concerning Big Yellow Group. The company has seen a lack of earnings growth as a result of retaining very little profits and whatever little it does retain, is being reinvested at a very low rate of return. Having said that, looking at current analyst estimates, we found that the company's earnings growth rate is expected to see a huge improvement. To know more about the latest analysts predictions for the company, check out this visualization of analyst forecasts for the company.
If you’re looking to trade Big Yellow Group, open an account with the lowest-cost* platform trusted by professionals, Interactive Brokers. Their clients from over 200 countries and territories trade stocks, options, futures, forex, bonds and funds worldwide from a single integrated account. Promoted
Valuation is complex, but we're here to simplify it.
Discover if Big Yellow Group might be undervalued or overvalued with our detailed analysis, featuring fair value estimates, potential risks, dividends, insider trades, and its financial condition.
Access Free AnalysisThis article by Simply Wall St is general in nature. It does not constitute a recommendation to buy or sell any stock, and does not take account of your objectives, or your financial situation. We aim to bring you long-term focused analysis driven by fundamental data. Note that our analysis may not factor in the latest price-sensitive company announcements or qualitative material. Simply Wall St has no position in any stocks mentioned.
*Interactive Brokers Rated Lowest Cost Broker by StockBrokers.com Annual Online Review 2020
Have feedback on this article? Concerned about the content? Get in touch with us directly. Alternatively, email editorial-team@simplywallst.com.
About LSE:BYG
Good value with adequate balance sheet and pays a dividend.
Similar Companies
Market Insights
Community Narratives


