
Advertisement
- United Kingdom
- /
- Pharma
- /
- AIM:EAH
Is There An Opportunity With ECO Animal Health Group plc's (LON:EAH) 38% Undervaluation?

Key Insights
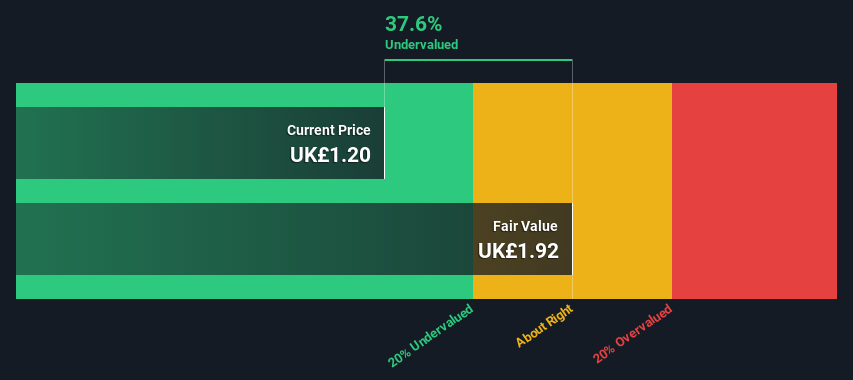
- ECO Animal Health Group's estimated fair value is UK£1.92 based on 2 Stage Free Cash Flow to Equity
- Current share price of UK£1.20 suggests ECO Animal Health Group is potentially 38% undervalued
- The UK£1.50 analyst price target for EAH is 22% less than our estimate of fair value
Does the September share price for ECO Animal Health Group plc (LON:EAH) reflect what it's really worth? Today, we will estimate the stock's intrinsic value by estimating the company's future cash flows and discounting them to their present value. Our analysis will employ the Discounted Cash Flow (DCF) model. Don't get put off by the jargon, the math behind it is actually quite straightforward.
Companies can be valued in a lot of ways, so we would point out that a DCF is not perfect for every situation. If you want to learn more about discounted cash flow, the rationale behind this calculation can be read in detail in the Simply Wall St analysis model.
View our latest analysis for ECO Animal Health Group
Step By Step Through The Calculation
We're using the 2-stage growth model, which simply means we take in account two stages of company's growth. In the initial period the company may have a higher growth rate and the second stage is usually assumed to have a stable growth rate. To start off with, we need to estimate the next ten years of cash flows. Where possible we use analyst estimates, but when these aren't available we extrapolate the previous free cash flow (FCF) from the last estimate or reported value. We assume companies with shrinking free cash flow will slow their rate of shrinkage, and that companies with growing free cash flow will see their growth rate slow, over this period. We do this to reflect that growth tends to slow more in the early years than it does in later years.
Generally we assume that a dollar today is more valuable than a dollar in the future, so we discount the value of these future cash flows to their estimated value in today's dollars:
10-year free cash flow (FCF) estimate
| 2024 | 2025 | 2026 | 2027 | 2028 | 2029 | 2030 | 2031 | 2032 | 2033 | |
| Levered FCF (£, Millions) | UK£3.73m | UK£2.32m | UK£3.50m | UK£6.10m | UK£6.50m | UK£6.79m | UK£7.03m | UK£7.24m | UK£7.42m | UK£7.57m |
| Growth Rate Estimate Source | Analyst x3 | Analyst x3 | Analyst x2 | Analyst x1 | Analyst x1 | Est @ 4.49% | Est @ 3.56% | Est @ 2.91% | Est @ 2.45% | Est @ 2.13% |
| Present Value (£, Millions) Discounted @ 6.1% | UK£3.5 | UK£2.1 | UK£2.9 | UK£4.8 | UK£4.8 | UK£4.8 | UK£4.6 | UK£4.5 | UK£4.3 | UK£4.2 |
("Est" = FCF growth rate estimated by Simply Wall St)
Present Value of 10-year Cash Flow (PVCF) = UK£41m
The second stage is also known as Terminal Value, this is the business's cash flow after the first stage. For a number of reasons a very conservative growth rate is used that cannot exceed that of a country's GDP growth. In this case we have used the 5-year average of the 10-year government bond yield (1.4%) to estimate future growth. In the same way as with the 10-year 'growth' period, we discount future cash flows to today's value, using a cost of equity of 6.1%.
Terminal Value (TV)= FCF2033 × (1 + g) ÷ (r – g) = UK£7.6m× (1 + 1.4%) ÷ (6.1%– 1.4%) = UK£162m
Present Value of Terminal Value (PVTV)= TV / (1 + r)10= UK£162m÷ ( 1 + 6.1%)10= UK£90m
The total value is the sum of cash flows for the next ten years plus the discounted terminal value, which results in the Total Equity Value, which in this case is UK£130m. The last step is to then divide the equity value by the number of shares outstanding. Relative to the current share price of UK£1.2, the company appears quite good value at a 38% discount to where the stock price trades currently. The assumptions in any calculation have a big impact on the valuation, so it is better to view this as a rough estimate, not precise down to the last cent.
Important Assumptions
The calculation above is very dependent on two assumptions. The first is the discount rate and the other is the cash flows. Part of investing is coming up with your own evaluation of a company's future performance, so try the calculation yourself and check your own assumptions. The DCF also does not consider the possible cyclicality of an industry, or a company's future capital requirements, so it does not give a full picture of a company's potential performance. Given that we are looking at ECO Animal Health Group as potential shareholders, the cost of equity is used as the discount rate, rather than the cost of capital (or weighted average cost of capital, WACC) which accounts for debt. In this calculation we've used 6.1%, which is based on a levered beta of 0.800. Beta is a measure of a stock's volatility, compared to the market as a whole. We get our beta from the industry average beta of globally comparable companies, with an imposed limit between 0.8 and 2.0, which is a reasonable range for a stable business.
SWOT Analysis for ECO Animal Health Group
Strength
- Currently debt free.
Weakness
- No major weaknesses identified for EAH.
Opportunity
- Annual earnings are forecast to grow faster than the British market.
- Trading below our estimate of fair value by more than 20%.
Threat
- Revenue is forecast to grow slower than 20% per year.
Looking Ahead:
Whilst important, the DCF calculation shouldn't be the only metric you look at when researching a company. The DCF model is not a perfect stock valuation tool. Preferably you'd apply different cases and assumptions and see how they would impact the company's valuation. For example, changes in the company's cost of equity or the risk free rate can significantly impact the valuation. Why is the intrinsic value higher than the current share price? For ECO Animal Health Group, there are three further items you should consider:
- Financial Health: Does EAH have a healthy balance sheet? Take a look at our free balance sheet analysis with six simple checks on key factors like leverage and risk.
- Future Earnings: How does EAH's growth rate compare to its peers and the wider market? Dig deeper into the analyst consensus number for the upcoming years by interacting with our free analyst growth expectation chart.
- Other High Quality Alternatives: Do you like a good all-rounder? Explore our interactive list of high quality stocks to get an idea of what else is out there you may be missing!
PS. Simply Wall St updates its DCF calculation for every British stock every day, so if you want to find the intrinsic value of any other stock just search here.
Valuation is complex, but we're here to simplify it.
Discover if ECO Animal Health Group might be undervalued or overvalued with our detailed analysis, featuring fair value estimates, potential risks, dividends, insider trades, and its financial condition.
Access Free AnalysisHave feedback on this article? Concerned about the content? Get in touch with us directly. Alternatively, email editorial-team (at) simplywallst.com.
This article by Simply Wall St is general in nature. We provide commentary based on historical data and analyst forecasts only using an unbiased methodology and our articles are not intended to be financial advice. It does not constitute a recommendation to buy or sell any stock, and does not take account of your objectives, or your financial situation. We aim to bring you long-term focused analysis driven by fundamental data. Note that our analysis may not factor in the latest price-sensitive company announcements or qualitative material. Simply Wall St has no position in any stocks mentioned.
About AIM:EAH
ECO Animal Health Group
Develops, registers, and markets pharmaceutical products for animals worldwide.
Flawless balance sheet with reasonable growth potential.
Market Insights

Advertisement
Community Narratives

BMW cruising ahead with new EVs and premium models to boost revenue 5%
Fair Value €135.07|44.6% undervalued
UN
Community Contributor
EU#2 - From Humble Beginnings to Global Powerhouse
Fair Value DKK 851.04|48.2% undervalued
TO
Community Contributor