
Advertisement
- United Kingdom
- /
- Pharma
- /
- AIM:EAH
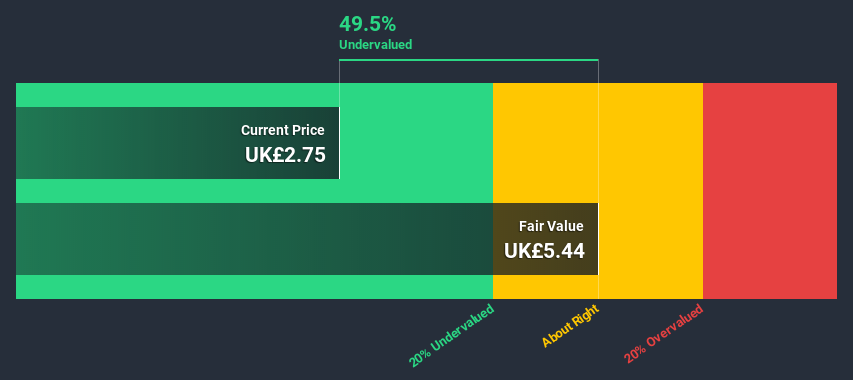
An Intrinsic Calculation For ECO Animal Health Group plc (LON:EAH) Suggests It's 49% Undervalued

Today we will run through one way of estimating the intrinsic value of ECO Animal Health Group plc (LON:EAH) by estimating the company's future cash flows and discounting them to their present value. Our analysis will employ the Discounted Cash Flow (DCF) model. It may sound complicated, but actually it is quite simple!
Companies can be valued in a lot of ways, so we would point out that a DCF is not perfect for every situation. If you want to learn more about discounted cash flow, the rationale behind this calculation can be read in detail in the Simply Wall St analysis model.
See our latest analysis for ECO Animal Health Group
Crunching the numbers
We use what is known as a 2-stage model, which simply means we have two different periods of growth rates for the company's cash flows. Generally the first stage is higher growth, and the second stage is a lower growth phase. To start off with, we need to estimate the next ten years of cash flows. Where possible we use analyst estimates, but when these aren't available we extrapolate the previous free cash flow (FCF) from the last estimate or reported value. We assume companies with shrinking free cash flow will slow their rate of shrinkage, and that companies with growing free cash flow will see their growth rate slow, over this period. We do this to reflect that growth tends to slow more in the early years than it does in later years.
A DCF is all about the idea that a dollar in the future is less valuable than a dollar today, so we need to discount the sum of these future cash flows to arrive at a present value estimate:
10-year free cash flow (FCF) estimate
| 2021 | 2022 | 2023 | 2024 | 2025 | 2026 | 2027 | 2028 | 2029 | 2030 | |
| Levered FCF (£, Millions) | UK£4.68m | UK£7.94m | UK£10.6m | UK£13.1m | UK£15.4m | UK£17.2m | UK£18.8m | UK£20.0m | UK£20.9m | UK£21.7m |
| Growth Rate Estimate Source | Analyst x1 | Analyst x1 | Est @ 33.6% | Est @ 23.82% | Est @ 16.97% | Est @ 12.18% | Est @ 8.83% | Est @ 6.48% | Est @ 4.84% | Est @ 3.68% |
| Present Value (£, Millions) Discounted @ 5.8% | UK£4.4 | UK£7.1 | UK£9.0 | UK£10.5 | UK£11.6 | UK£12.3 | UK£12.7 | UK£12.8 | UK£12.6 | UK£12.4 |
("Est" = FCF growth rate estimated by Simply Wall St)
Present Value of 10-year Cash Flow (PVCF) = UK£105m
The second stage is also known as Terminal Value, this is the business's cash flow after the first stage. The Gordon Growth formula is used to calculate Terminal Value at a future annual growth rate equal to the 5-year average of the 10-year government bond yield of 1.0%. We discount the terminal cash flows to today's value at a cost of equity of 5.8%.
Terminal Value (TV)= FCF2030 × (1 + g) ÷ (r – g) = UK£22m× (1 + 1.0%) ÷ (5.8%– 1.0%) = UK£460m
Present Value of Terminal Value (PVTV)= TV / (1 + r)10= UK£460m÷ ( 1 + 5.8%)10= UK£263m
The total value, or equity value, is then the sum of the present value of the future cash flows, which in this case is UK£368m. In the final step we divide the equity value by the number of shares outstanding. Relative to the current share price of UK£2.8, the company appears quite undervalued at a 49% discount to where the stock price trades currently. Remember though, that this is just an approximate valuation, and like any complex formula - garbage in, garbage out.
The assumptions
Now the most important inputs to a discounted cash flow are the discount rate, and of course, the actual cash flows. Part of investing is coming up with your own evaluation of a company's future performance, so try the calculation yourself and check your own assumptions. The DCF also does not consider the possible cyclicality of an industry, or a company's future capital requirements, so it does not give a full picture of a company's potential performance. Given that we are looking at ECO Animal Health Group as potential shareholders, the cost of equity is used as the discount rate, rather than the cost of capital (or weighted average cost of capital, WACC) which accounts for debt. In this calculation we've used 5.8%, which is based on a levered beta of 0.800. Beta is a measure of a stock's volatility, compared to the market as a whole. We get our beta from the industry average beta of globally comparable companies, with an imposed limit between 0.8 and 2.0, which is a reasonable range for a stable business.
Next Steps:
Although the valuation of a company is important, it shouldn't be the only metric you look at when researching a company. DCF models are not the be-all and end-all of investment valuation. Rather it should be seen as a guide to "what assumptions need to be true for this stock to be under/overvalued?" If a company grows at a different rate, or if its cost of equity or risk free rate changes sharply, the output can look very different. Why is the intrinsic value higher than the current share price? For ECO Animal Health Group, we've put together three additional aspects you should explore:
- Risks: Take risks, for example - ECO Animal Health Group has 3 warning signs we think you should be aware of.
- Future Earnings: How does EAH's growth rate compare to its peers and the wider market? Dig deeper into the analyst consensus number for the upcoming years by interacting with our free analyst growth expectation chart.
- Other High Quality Alternatives: Do you like a good all-rounder? Explore our interactive list of high quality stocks to get an idea of what else is out there you may be missing!
PS. The Simply Wall St app conducts a discounted cash flow valuation for every stock on the AIM every day. If you want to find the calculation for other stocks just search here.
If you decide to trade ECO Animal Health Group, use the lowest-cost* platform that is rated #1 Overall by Barron’s, Interactive Brokers. Trade stocks, options, futures, forex, bonds and funds on 135 markets, all from a single integrated account. Promoted
Valuation is complex, but we're here to simplify it.
Discover if ECO Animal Health Group might be undervalued or overvalued with our detailed analysis, featuring fair value estimates, potential risks, dividends, insider trades, and its financial condition.
Access Free AnalysisThis article by Simply Wall St is general in nature. It does not constitute a recommendation to buy or sell any stock, and does not take account of your objectives, or your financial situation. We aim to bring you long-term focused analysis driven by fundamental data. Note that our analysis may not factor in the latest price-sensitive company announcements or qualitative material. Simply Wall St has no position in any stocks mentioned.
*Interactive Brokers Rated Lowest Cost Broker by StockBrokers.com Annual Online Review 2020
Have feedback on this article? Concerned about the content? Get in touch with us directly. Alternatively, email editorial-team@simplywallst.com.
About AIM:EAH
ECO Animal Health Group
Develops, registers, and markets pharmaceutical products for animals worldwide.
Flawless balance sheet with reasonable growth potential.
Market Insights

Advertisement
Community Narratives
MicroStrategy: Volatile Gamble or Golden Opportunity?
Fair Value US$663.00|35.7% undervalued
BL
Community Contributor
Emerging Markets and Debt Reduction Will Propel Bath & Body Works Forward
Fair Value US$40.73|20.5% undervalued
ZW
Community Contributor
An amazing opportunity to potentially get a 100 bagger
Fair Value US$10.00|25.2% overvalued
DA
Community Contributor