
Advertisement
What are the early trends we should look for to identify a stock that could multiply in value over the long term? Firstly, we'd want to identify a growing return on capital employed (ROCE) and then alongside that, an ever-increasing base of capital employed. Ultimately, this demonstrates that it's a business that is reinvesting profits at increasing rates of return. Although, when we looked at Mission Group (LON:TMG), it didn't seem to tick all of these boxes.
Understanding Return On Capital Employed (ROCE)
For those who don't know, ROCE is a measure of a company's yearly pre-tax profit (its return), relative to the capital employed in the business. The formula for this calculation on Mission Group is:
Return on Capital Employed = Earnings Before Interest and Tax (EBIT) ÷ (Total Assets - Current Liabilities)
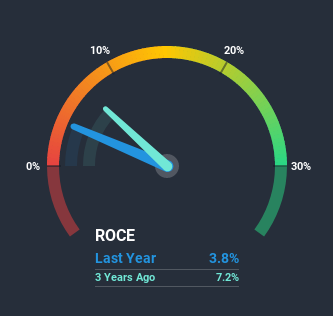
0.038 = UK£4.1m ÷ (UK£146m - UK£39m) (Based on the trailing twelve months to June 2020).
Thus, Mission Group has an ROCE of 3.8%. In absolute terms, that's a low return and it also under-performs the Media industry average of 8.7%.
View our latest analysis for Mission Group
In the above chart we have measured Mission Group's prior ROCE against its prior performance, but the future is arguably more important. If you're interested, you can view the analysts predictions in our free report on analyst forecasts for the company.
So How Is Mission Group's ROCE Trending?
On the surface, the trend of ROCE at Mission Group doesn't inspire confidence. To be more specific, ROCE has fallen from 7.0% over the last five years. Given the business is employing more capital while revenue has slipped, this is a bit concerning. If this were to continue, you might be looking at a company that is trying to reinvest for growth but is actually losing market share since sales haven't increased.
In Conclusion...
We're a bit apprehensive about Mission Group because despite more capital being deployed in the business, returns on that capital and sales have both fallen. The market must be rosy on the stock's future because even though the underlying trends aren't too encouraging, the stock has soared 129%. In any case, the current underlying trends don't bode well for long term performance so unless they reverse, we'd start looking elsewhere.
On a final note, we've found 4 warning signs for Mission Group that we think you should be aware of.
If you want to search for solid companies with great earnings, check out this free list of companies with good balance sheets and impressive returns on equity.
If you’re looking to trade Mission Group, open an account with the lowest-cost* platform trusted by professionals, Interactive Brokers. Their clients from over 200 countries and territories trade stocks, options, futures, forex, bonds and funds worldwide from a single integrated account. Promoted
New: Manage All Your Stock Portfolios in One Place
We've created the ultimate portfolio companion for stock investors, and it's free.
• Connect an unlimited number of Portfolios and see your total in one currency
• Be alerted to new Warning Signs or Risks via email or mobile
• Track the Fair Value of your stocks
This article by Simply Wall St is general in nature. It does not constitute a recommendation to buy or sell any stock, and does not take account of your objectives, or your financial situation. We aim to bring you long-term focused analysis driven by fundamental data. Note that our analysis may not factor in the latest price-sensitive company announcements or qualitative material. Simply Wall St has no position in any stocks mentioned.
*Interactive Brokers Rated Lowest Cost Broker by StockBrokers.com Annual Online Review 2020
Have feedback on this article? Concerned about the content? Get in touch with us directly. Alternatively, email editorial-team (at) simplywallst.com.
About AIM:TMG
Mission Group
Operates as a collective of creative and martech agencies company in the United Kingdom, the United States, Asia, and rest of Europe.
Good value with adequate balance sheet.
Market Insights

Advertisement
Community Narratives
Kodiak AI - a potential 100 bagger opportunity?
Fair Value US$14.00|44.7% undervalued
DA
Community Contributor
A Fair Price for a Great Business Facing Real Threats
Fair Value US$383.06|13.0% undervalued
IM
Community Contributor
AXON And Shopify Integration Will Unlock Global Mobile Advertising
Fair Value US$646.30|7.3% undervalued
AN
Based on Analyst Price Targets