
Advertisement
The external fund manager backed by Berkshire Hathaway's Charlie Munger, Li Lu, makes no bones about it when he says 'The biggest investment risk is not the volatility of prices, but whether you will suffer a permanent loss of capital.' When we think about how risky a company is, we always like to look at its use of debt, since debt overload can lead to ruin. We note that The Mission Group plc (LON:TMG) does have debt on its balance sheet. But the real question is whether this debt is making the company risky.
What Risk Does Debt Bring?
Debt assists a business until the business has trouble paying it off, either with new capital or with free cash flow. Part and parcel of capitalism is the process of 'creative destruction' where failed businesses are mercilessly liquidated by their bankers. While that is not too common, we often do see indebted companies permanently diluting shareholders because lenders force them to raise capital at a distressed price. Of course, plenty of companies use debt to fund growth, without any negative consequences. The first thing to do when considering how much debt a business uses is to look at its cash and debt together.
Check out our latest analysis for Mission Group
How Much Debt Does Mission Group Carry?
You can click the graphic below for the historical numbers, but it shows that as of June 2023 Mission Group had UK£20.0m of debt, an increase on UK£14.9m, over one year. However, it also had UK£5.10m in cash, and so its net debt is UK£14.9m.
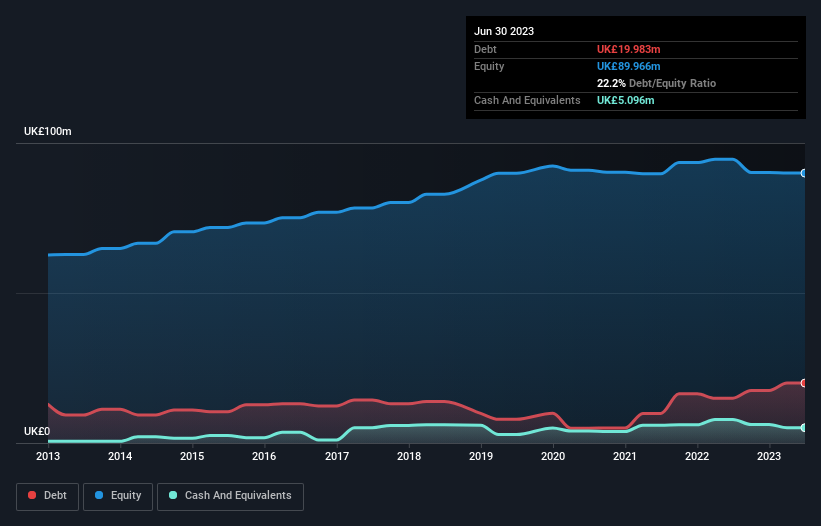
A Look At Mission Group's Liabilities
According to the last reported balance sheet, Mission Group had liabilities of UK£54.1m due within 12 months, and liabilities of UK£42.1m due beyond 12 months. Offsetting these obligations, it had cash of UK£5.10m as well as receivables valued at UK£53.8m due within 12 months. So it has liabilities totalling UK£37.3m more than its cash and near-term receivables, combined.
When you consider that this deficiency exceeds the company's UK£33.1m market capitalization, you might well be inclined to review the balance sheet intently. Hypothetically, extremely heavy dilution would be required if the company were forced to pay down its liabilities by raising capital at the current share price.
We use two main ratios to inform us about debt levels relative to earnings. The first is net debt divided by earnings before interest, tax, depreciation, and amortization (EBITDA), while the second is how many times its earnings before interest and tax (EBIT) covers its interest expense (or its interest cover, for short). This way, we consider both the absolute quantum of the debt, as well as the interest rates paid on it.
Mission Group's net debt is sitting at a very reasonable 1.8 times its EBITDA, while its EBIT covered its interest expense just 4.0 times last year. While that doesn't worry us too much, it does suggest the interest payments are somewhat of a burden. The bad news is that Mission Group saw its EBIT decline by 13% over the last year. If earnings continue to decline at that rate then handling the debt will be more difficult than taking three children under 5 to a fancy pants restaurant. When analysing debt levels, the balance sheet is the obvious place to start. But it is future earnings, more than anything, that will determine Mission Group's ability to maintain a healthy balance sheet going forward. So if you want to see what the professionals think, you might find this free report on analyst profit forecasts to be interesting.
Finally, a company can only pay off debt with cold hard cash, not accounting profits. So the logical step is to look at the proportion of that EBIT that is matched by actual free cash flow. In the last three years, Mission Group's free cash flow amounted to 46% of its EBIT, less than we'd expect. That's not great, when it comes to paying down debt.
Our View
On the face of it, Mission Group's EBIT growth rate left us tentative about the stock, and its level of total liabilities was no more enticing than the one empty restaurant on the busiest night of the year. Having said that, its ability handle its debt, based on its EBITDA, isn't such a worry. Looking at the bigger picture, it seems clear to us that Mission Group's use of debt is creating risks for the company. If everything goes well that may pay off but the downside of this debt is a greater risk of permanent losses. When analysing debt levels, the balance sheet is the obvious place to start. However, not all investment risk resides within the balance sheet - far from it. For example, we've discovered 2 warning signs for Mission Group (1 doesn't sit too well with us!) that you should be aware of before investing here.
If you're interested in investing in businesses that can grow profits without the burden of debt, then check out this free list of growing businesses that have net cash on the balance sheet.
New: Manage All Your Stock Portfolios in One Place
We've created the ultimate portfolio companion for stock investors, and it's free.
• Connect an unlimited number of Portfolios and see your total in one currency
• Be alerted to new Warning Signs or Risks via email or mobile
• Track the Fair Value of your stocks
Have feedback on this article? Concerned about the content? Get in touch with us directly. Alternatively, email editorial-team (at) simplywallst.com.
This article by Simply Wall St is general in nature. We provide commentary based on historical data and analyst forecasts only using an unbiased methodology and our articles are not intended to be financial advice. It does not constitute a recommendation to buy or sell any stock, and does not take account of your objectives, or your financial situation. We aim to bring you long-term focused analysis driven by fundamental data. Note that our analysis may not factor in the latest price-sensitive company announcements or qualitative material. Simply Wall St has no position in any stocks mentioned.
About AIM:TMG
Mission Group
Operates as a collective of creative and martech agencies company in the United Kingdom, the United States, Asia, and rest of Europe.
Good value with adequate balance sheet.
Market Insights

Advertisement
Community Narratives
The company that turned a verb into a global necessity and basically runs the modern internet, digital ads, smartphones, maps, and AI.
Fair Value US$300.00|8.5% undervalued
OS
Community Contributor
Flowers Foods Pays A Fair Price For Health
Fair Value US$16.12|24.6% undervalued
NV
Community Contributor
TMX Group will thrive with 33.3% profit margin and enduring market moat
Fair Value CA$49.90|0.1% undervalued
LI
Community Contributor