Advertisement
- United Kingdom
- /
- Entertainment
- /
- AIM:FDEV
Capital Allocation Trends At Frontier Developments (LON:FDEV) Aren't Ideal
Did you know there are some financial metrics that can provide clues of a potential multi-bagger? Amongst other things, we'll want to see two things; firstly, a growing return on capital employed (ROCE) and secondly, an expansion in the company's amount of capital employed. Ultimately, this demonstrates that it's a business that is reinvesting profits at increasing rates of return. Although, when we looked at Frontier Developments (LON:FDEV), it didn't seem to tick all of these boxes.
Understanding Return On Capital Employed (ROCE)
Just to clarify if you're unsure, ROCE is a metric for evaluating how much pre-tax income (in percentage terms) a company earns on the capital invested in its business. Analysts use this formula to calculate it for Frontier Developments:
Return on Capital Employed = Earnings Before Interest and Tax (EBIT) ÷ (Total Assets - Current Liabilities)
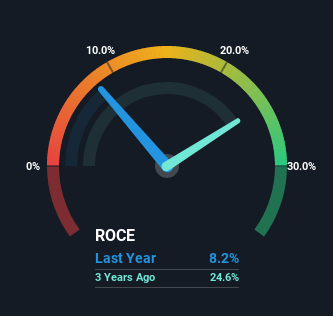
0.082 = UK£12m ÷ (UK£165m - UK£23m) (Based on the trailing twelve months to November 2021).
Thus, Frontier Developments has an ROCE of 8.2%. In absolute terms, that's a low return and it also under-performs the Entertainment industry average of 16%.
View our latest analysis for Frontier Developments
In the above chart we have measured Frontier Developments' prior ROCE against its prior performance, but the future is arguably more important. If you'd like, you can check out the forecasts from the analysts covering Frontier Developments here for free.
What Can We Tell From Frontier Developments' ROCE Trend?
In terms of Frontier Developments' historical ROCE movements, the trend isn't fantastic. Over the last five years, returns on capital have decreased to 8.2% from 16% five years ago. However, given capital employed and revenue have both increased it appears that the business is currently pursuing growth, at the consequence of short term returns. If these investments prove successful, this can bode very well for long term stock performance.
In Conclusion...
In summary, despite lower returns in the short term, we're encouraged to see that Frontier Developments is reinvesting for growth and has higher sales as a result. And long term investors must be optimistic going forward because the stock has returned a huge 160% to shareholders in the last five years. So should these growth trends continue, we'd be optimistic on the stock going forward.
One more thing to note, we've identified 2 warning signs with Frontier Developments and understanding them should be part of your investment process.
If you want to search for solid companies with great earnings, check out this free list of companies with good balance sheets and impressive returns on equity.
New: AI Stock Screener & Alerts
Our new AI Stock Screener scans the market every day to uncover opportunities.
• Dividend Powerhouses (3%+ Yield)
• Undervalued Small Caps with Insider Buying
• High growth Tech and AI Companies
Or build your own from over 50 metrics.
Have feedback on this article? Concerned about the content? Get in touch with us directly. Alternatively, email editorial-team (at) simplywallst.com.
This article by Simply Wall St is general in nature. We provide commentary based on historical data and analyst forecasts only using an unbiased methodology and our articles are not intended to be financial advice. It does not constitute a recommendation to buy or sell any stock, and does not take account of your objectives, or your financial situation. We aim to bring you long-term focused analysis driven by fundamental data. Note that our analysis may not factor in the latest price-sensitive company announcements or qualitative material. Simply Wall St has no position in any stocks mentioned.
About AIM:FDEV
Frontier Developments
Develops and publishes video games for the interactive entertainment sector.
Flawless balance sheet and good value.
Similar Companies
Market Insights


Advertisement
Weekly Picks
ST


stuart_roberts on Upside Gold ·
An Undervalued 3.3Moz Gold Project in Canada
Fair Value:CA$5.0775.9% undervalued
32 followersusers have followed this narrative
0 commentsusers have commented on this narrative
5 likesusers have liked this narrative
JA

Jades on Coca-Cola ·
Coca-Cola’s Enduring Moat in a Health-Conscious World: Steady Compounder Poised for 5-10% Annual Returns Through Emerging Market Dominance
Fair Value:US$66.221.6% overvalued
16 followersusers have followed this narrative
0 commentsusers have commented on this narrative
8 likesusers have liked this narrative
ET

Ethan_cpa on Xero ·
Xero: Growth Was Priced In — Execution Is Not
Fair Value:AU$101.5618.1% undervalued
6 followersusers have followed this narrative
1 commentusers have commented on this narrative
4 likesusers have liked this narrative
KA

kabz2342 on Nu Holdings ·
Nu holdings will continue to disrupt the South American banking market
Fair Value:US$64.376.6% undervalued
39 followersusers have followed this narrative
3 commentsusers have commented on this narrative
23 likesusers have liked this narrative
Recently Updated Narratives
AA

Aadi_S on Take-Two Interactive Software ·
Take Two Interactive Software TTWO Valuation Analysis
Fair Value:US$88.99139.7% overvalued
1 followerusers have followed this narrative
0 commentsusers have commented on this narrative
0 likesusers have liked this narrative
YI

yiannisz on Cango ·
Cango’s Shift Toward Distributed Compute
Fair Value:US$0.2320.8% overvalued
1 followerusers have followed this narrative
0 commentsusers have commented on this narrative
0 likesusers have liked this narrative
IZ

izzy on Rocket Lab ·
Rocket Lab: Transitioning to a Diversified Space Infrastructure Platform
Fair Value:US$8413.5% undervalued
8 followersusers have followed this narrative
0 commentsusers have commented on this narrative
0 likesusers have liked this narrative
Popular Narratives
DA


davidlsander on Ubisoft Entertainment ·
Is Ubisoft the Market’s Biggest Pricing Error? Why Forensic Value Points to €33 Per Share
Fair Value:€33.886.7% undervalued
66 followersusers have followed this narrative
5 commentsusers have commented on this narrative
28 likesusers have liked this narrative
AN


AnalystConsensusTarget on Microsoft ·
Analyst Commentary Highlights Microsoft AI Momentum and Upward Valuation Amid Growth and Competitive Risks
Fair Value:US$59632.6% undervalued
1297 followersusers have followed this narrative
2 commentsusers have commented on this narrative
10 likesusers have liked this narrative
TA


Talos on Tesla ·
The "Physical AI" Monopoly – A New Industrial Revolution
Fair Value:US$665.3638.6% undervalued
49 followersusers have followed this narrative
20 commentsusers have commented on this narrative
22 likesusers have liked this narrative


