
Advertisement
- United Kingdom
- /
- Chemicals
- /
- LSE:SYNT
Even With A 45% Surge, Cautious Investors Are Not Rewarding Synthomer plc's (LON:SYNT) Performance Completely
Synthomer plc (LON:SYNT) shareholders would be excited to see that the share price has had a great month, posting a 45% gain and recovering from prior weakness. Still, the 30-day jump doesn't change the fact that longer term shareholders have seen their stock decimated by the 92% share price drop in the last twelve months.
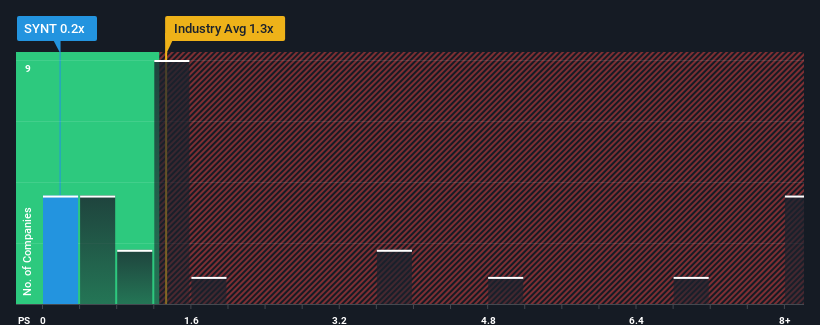
Although its price has surged higher, given about half the companies operating in the United Kingdom's Chemicals industry have price-to-sales ratios (or "P/S") above 1.3x, you may still consider Synthomer as an attractive investment with its 0.2x P/S ratio. Although, it's not wise to just take the P/S at face value as there may be an explanation why it's limited.
Check out our latest analysis for Synthomer
How Has Synthomer Performed Recently?
Recent times haven't been great for Synthomer as its revenue has been falling quicker than most other companies. Perhaps the market isn't expecting future revenue performance to improve, which has kept the P/S suppressed. So while you could say the stock is cheap, investors will be looking for improvement before they see it as good value. If not, then existing shareholders will probably struggle to get excited about the future direction of the share price.
Want the full picture on analyst estimates for the company? Then our free report on Synthomer will help you uncover what's on the horizon.What Are Revenue Growth Metrics Telling Us About The Low P/S?
Synthomer's P/S ratio would be typical for a company that's only expected to deliver limited growth, and importantly, perform worse than the industry.
Taking a look back first, the company's revenue growth last year wasn't something to get excited about as it posted a disappointing decline of 17%. This has soured the latest three-year period, which nevertheless managed to deliver a decent 20% overall rise in revenue. So we can start by confirming that the company has generally done a good job of growing revenue over that time, even though it had some hiccups along the way.
Shifting to the future, estimates from the eight analysts covering the company suggest revenue growth will be highly resilient over the next three years growing by 7.6% each year. That would be an excellent outcome when the industry is expected to decline by 1.9% per year.
With this in mind, we find it intriguing that Synthomer's P/S falls short of its industry peers. It looks like most investors aren't convinced at all that the company can achieve positive future growth in the face of a shrinking broader industry.
What Does Synthomer's P/S Mean For Investors?
Synthomer's stock price has surged recently, but its but its P/S still remains modest. It's argued the price-to-sales ratio is an inferior measure of value within certain industries, but it can be a powerful business sentiment indicator.
Our examination of Synthomer's analyst forecasts revealed that its superior revenue outlook against a shaky industry isn't contributing to its P/S anywhere near as much as we would have predicted. When we see a superior revenue outlook with some actual growth, we can only assume investor uncertainty is what's been suppressing the P/S figures. Perhaps there is some hesitation about the company's ability to keep swimming against the current of the broader industry turmoil. However, if you agree with the analysts' forecasts, you may be able to pick up the stock at an attractive price.
Before you settle on your opinion, we've discovered 3 warning signs for Synthomer that you should be aware of.
If you're unsure about the strength of Synthomer's business, why not explore our interactive list of stocks with solid business fundamentals for some other companies you may have missed.
New: Manage All Your Stock Portfolios in One Place
We've created the ultimate portfolio companion for stock investors, and it's free.
• Connect an unlimited number of Portfolios and see your total in one currency
• Be alerted to new Warning Signs or Risks via email or mobile
• Track the Fair Value of your stocks
Have feedback on this article? Concerned about the content? Get in touch with us directly. Alternatively, email editorial-team (at) simplywallst.com.
This article by Simply Wall St is general in nature. We provide commentary based on historical data and analyst forecasts only using an unbiased methodology and our articles are not intended to be financial advice. It does not constitute a recommendation to buy or sell any stock, and does not take account of your objectives, or your financial situation. We aim to bring you long-term focused analysis driven by fundamental data. Note that our analysis may not factor in the latest price-sensitive company announcements or qualitative material. Simply Wall St has no position in any stocks mentioned.
About LSE:SYNT
Synthomer
Manufactures and supplies specialised polymers and ingredients for coatings, construction, adhesives, and health and protection sectors.
Undervalued with imperfect balance sheet.
Similar Companies
Market Insights

Advertisement
Weekly Picks
RO


RockeTeller on Santacruz Silver Mining ·
Crazy Undervalued 42 Baggers Silver Play (Active & Running Mine)
Fair Value:CA$8696.7% undervalued
74 followersusers have followed this narrative
7 commentsusers have commented on this narrative
21 likesusers have liked this narrative
RO


Robbo on Fiducian Group ·
Fiducian: Compliance Clouds or Value Opportunity?
Fair Value:AU$121.2% undervalued
13 followersusers have followed this narrative
0 commentsusers have commented on this narrative
1 likeusers have liked this narrative
WO

woodworthfund on Willamette Valley Vineyards ·
Willamette Valley Vineyards (WVVI): Not-So-Great Value
Fair Value:US$245.0% overvalued
11 followersusers have followed this narrative
0 commentsusers have commented on this narrative
1 likeusers have liked this narrative
Recently Updated Narratives
NO

Norms70 on Standard Lithium ·
SLI is share to watch next 5 years
Fair Value:€4.59.8% undervalued
1 followerusers have followed this narrative
0 commentsusers have commented on this narrative
0 likesusers have liked this narrative
DA


davidlsander on Beam Therapeutics ·
The "Molecular Pencil": Why Beam's Technology is Built to Win
Fair Value:US$15081.9% undervalued
59 followersusers have followed this narrative
3 commentsusers have commented on this narrative
0 likesusers have liked this narrative
RE

RedhawkCC on Prime Medicine ·
PRME remains a long shot but publication in the New England Journal of Medicine helps.
Fair Value:US$0.0469.1k% overvalued
1 followerusers have followed this narrative
0 commentsusers have commented on this narrative
0 likesusers have liked this narrative
Popular Narratives
TH


TheWallstreetKing on MicroVision ·
MicroVision will explode future revenue by 380.37% with a vision towards success
Fair Value:US$6098.5% undervalued
118 followersusers have followed this narrative
11 commentsusers have commented on this narrative
22 likesusers have liked this narrative
AN


AnalystConsensusTarget on NVIDIA ·
NVDA: Expanding AI Demand Will Drive Major Data Center Investments Through 2026
Fair Value:US$250.3925.9% undervalued
962 followersusers have followed this narrative
6 commentsusers have commented on this narrative
25 likesusers have liked this narrative
RO
RockeTeller on Santacruz Silver Mining ·
Crazy Undervalued 42 Baggers Silver Play (Active & Running Mine)
Fair Value:CA$8696.7% undervalued
74 followersusers have followed this narrative
7 commentsusers have commented on this narrative
21 likesusers have liked this narrative
