
Advertisement
- United Kingdom
- /
- Chemicals
- /
- LSE:HEIQ
Slammed 26% HeiQ Plc (LON:HEIQ) Screens Well Here But There Might Be A Catch
Unfortunately for some shareholders, the HeiQ Plc (LON:HEIQ) share price has dived 26% in the last thirty days, prolonging recent pain. The recent drop completes a disastrous twelve months for shareholders, who are sitting on a 70% loss during that time.
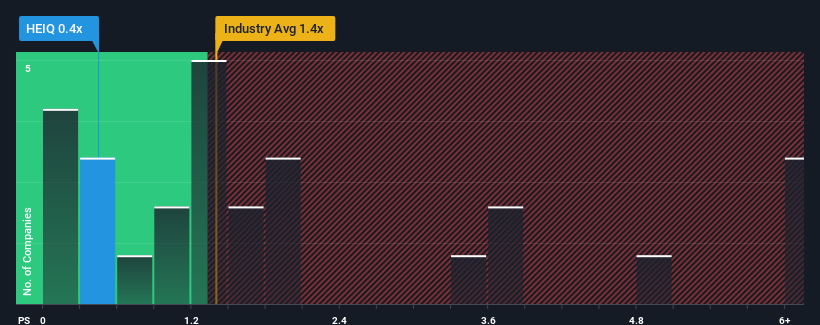
Following the heavy fall in price, it would be understandable if you think HeiQ is a stock with good investment prospects with a price-to-sales ratios (or "P/S") of 0.4x, considering almost half the companies in the United Kingdom's Chemicals industry have P/S ratios above 1.4x. Although, it's not wise to just take the P/S at face value as there may be an explanation why it's limited.
Check out our latest analysis for HeiQ
What Does HeiQ's Recent Performance Look Like?
With revenue that's retreating more than the industry's average of late, HeiQ has been very sluggish. Perhaps the market isn't expecting future revenue performance to improve, which has kept the P/S suppressed. You'd much rather the company improve its revenue performance if you still believe in the business. Or at the very least, you'd be hoping the revenue slide doesn't get any worse if your plan is to pick up some stock while it's out of favour.
If you'd like to see what analysts are forecasting going forward, you should check out our free report on HeiQ.How Is HeiQ's Revenue Growth Trending?
In order to justify its P/S ratio, HeiQ would need to produce sluggish growth that's trailing the industry.
In reviewing the last year of financials, we were disheartened to see the company's revenues fell to the tune of 30%. This means it has also seen a slide in revenue over the longer-term as revenue is down 10% in total over the last three years. Therefore, it's fair to say the revenue growth recently has been undesirable for the company.
Turning to the outlook, the next year should demonstrate the company's robustness, generating growth of 5.9% as estimated by the one analyst watching the company. Meanwhile, the broader industry is forecast to contract by 18%, which would indicate the company is doing very well.
With this in mind, we find it intriguing that HeiQ's P/S falls short of its industry peers. Apparently some shareholders are doubtful of the contrarian forecasts and have been accepting significantly lower selling prices.
What We Can Learn From HeiQ's P/S?
The southerly movements of HeiQ's shares means its P/S is now sitting at a pretty low level. Using the price-to-sales ratio alone to determine if you should sell your stock isn't sensible, however it can be a practical guide to the company's future prospects.
Our look into HeiQ's analyst forecasts has shown that it could be trading at a significant discount in terms of P/S, as it is expected to far outperform the industry. There could be some major unobserved threats to revenue preventing the P/S ratio from matching the positive outlook. One major risk is whether its revenue trajectory can keep outperforming under these tough industry conditions. It appears many are indeed anticipating revenue instability, because the company's current prospects should normally provide a boost to the share price.
You should always think about risks. Case in point, we've spotted 5 warning signs for HeiQ you should be aware of, and 1 of them is concerning.
If strong companies turning a profit tickle your fancy, then you'll want to check out this free list of interesting companies that trade on a low P/E (but have proven they can grow earnings).
Valuation is complex, but we're here to simplify it.
Discover if HeiQ might be undervalued or overvalued with our detailed analysis, featuring fair value estimates, potential risks, dividends, insider trades, and its financial condition.
Access Free AnalysisHave feedback on this article? Concerned about the content? Get in touch with us directly. Alternatively, email editorial-team (at) simplywallst.com.
This article by Simply Wall St is general in nature. We provide commentary based on historical data and analyst forecasts only using an unbiased methodology and our articles are not intended to be financial advice. It does not constitute a recommendation to buy or sell any stock, and does not take account of your objectives, or your financial situation. We aim to bring you long-term focused analysis driven by fundamental data. Note that our analysis may not factor in the latest price-sensitive company announcements or qualitative material. Simply Wall St has no position in any stocks mentioned.
About LSE:HEIQ
HeiQ
Through its subsidiaries, operates in the antimicrobial fabrics, textiles and flooring, and life sciences businesses in Europe, North and South America, Asia, and internationally.
Moderate with mediocre balance sheet.
Market Insights

Advertisement
Community Narratives
Quality at a Premium. A time to watch, not to buy?
Fair Value US$154.56|29.9% undervalued
DA
Community Contributor
GRAB: The Super-App at the Heart of Southeast Asia’s Digital Boom
Fair Value US$8.20|22.9% undervalued
BL
Community Contributor
Verve Group to Surge with 51.61% Revenue Growth
Fair Value €6.00|64.1% undervalued
ME
Community Contributor