
Advertisement
- United Kingdom
- /
- Chemicals
- /
- LSE:HEIQ
HeiQ Plc (LON:HEIQ) Stock's 51% Dive Might Signal An Opportunity But It Requires Some Scrutiny
Unfortunately for some shareholders, the HeiQ Plc (LON:HEIQ) share price has dived 51% in the last thirty days, prolonging recent pain. To make matters worse, the recent drop has wiped out a year's worth of gains with the share price now back where it started a year ago.
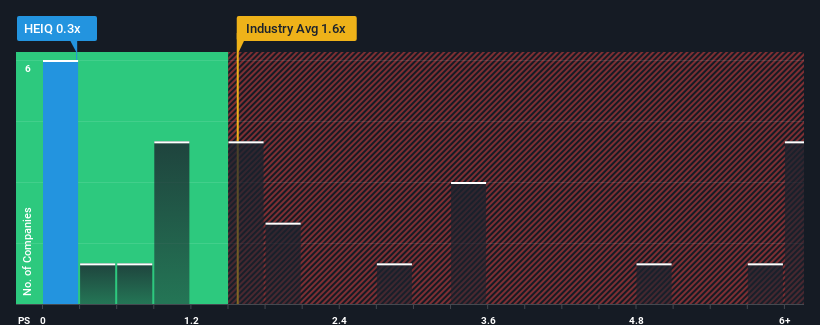
Since its price has dipped substantially, HeiQ may be sending buy signals at present with its price-to-sales (or "P/S") ratio of 0.3x, considering almost half of all companies in the Chemicals industry in the United Kingdom have P/S ratios greater than 1.6x and even P/S higher than 4x aren't out of the ordinary. Although, it's not wise to just take the P/S at face value as there may be an explanation why it's limited.
See our latest analysis for HeiQ
What Does HeiQ's P/S Mean For Shareholders?
The recently shrinking revenue for HeiQ has been in line with the industry. One possibility is that the P/S ratio is low because investors think the company's revenue may begin to slide even faster. You'd much rather the company continue improving its revenue if you still believe in the business. At the very least, you'd be hoping that revenue doesn't fall off a cliff if your plan is to pick up some stock while it's out of favour.
Keen to find out how analysts think HeiQ's future stacks up against the industry? In that case, our free report is a great place to start.Do Revenue Forecasts Match The Low P/S Ratio?
The only time you'd be truly comfortable seeing a P/S as low as HeiQ's is when the company's growth is on track to lag the industry.
In reviewing the last year of financials, we were disheartened to see the company's revenues fell to the tune of 12%. The last three years don't look nice either as the company has shrunk revenue by 17% in aggregate. Therefore, it's fair to say the revenue growth recently has been undesirable for the company.
Shifting to the future, estimates from the only analyst covering the company suggest revenue growth will be highly resilient over the next year growing by 5.5%. With the rest of the industry predicted to shrink by 13%, that would be a fantastic result.
With this in mind, we find it intriguing that HeiQ's P/S falls short of its industry peers. It looks like most investors aren't convinced at all that the company can achieve positive future growth in the face of a shrinking broader industry.
The Key Takeaway
HeiQ's P/S has taken a dip along with its share price. We'd say the price-to-sales ratio's power isn't primarily as a valuation instrument but rather to gauge current investor sentiment and future expectations.
Our look into HeiQ's analyst forecasts has shown that it could be trading at a significant discount in terms of P/S, as it is expected to far outperform the industry. We believe there could be some underlying risks that are keeping the P/S modest in the context of above-average revenue growth. Amidst challenging industry conditions, a key concern is whether the company can sustain its superior revenue growth trajectory. However, if you agree with the analysts' forecasts, you may be able to pick up the stock at an attractive price.
Having said that, be aware HeiQ is showing 4 warning signs in our investment analysis, and 1 of those doesn't sit too well with us.
Of course, profitable companies with a history of great earnings growth are generally safer bets. So you may wish to see this free collection of other companies that have reasonable P/E ratios and have grown earnings strongly.
Valuation is complex, but we're here to simplify it.
Discover if HeiQ might be undervalued or overvalued with our detailed analysis, featuring fair value estimates, potential risks, dividends, insider trades, and its financial condition.
Access Free AnalysisHave feedback on this article? Concerned about the content? Get in touch with us directly. Alternatively, email editorial-team (at) simplywallst.com.
This article by Simply Wall St is general in nature. We provide commentary based on historical data and analyst forecasts only using an unbiased methodology and our articles are not intended to be financial advice. It does not constitute a recommendation to buy or sell any stock, and does not take account of your objectives, or your financial situation. We aim to bring you long-term focused analysis driven by fundamental data. Note that our analysis may not factor in the latest price-sensitive company announcements or qualitative material. Simply Wall St has no position in any stocks mentioned.
About LSE:HEIQ
HeiQ
Through its subsidiaries, operates in the antimicrobial fabrics, textiles and flooring, and life sciences businesses in Europe, North and South America, Asia, and internationally.
Moderate with mediocre balance sheet.
Market Insights

Advertisement
Community Narratives
The company that turned a verb into a global necessity and basically runs the modern internet, digital ads, smartphones, maps, and AI.
Fair Value US$300.00|6.3% undervalued
OS
Community Contributor
Flowers Foods Pays A Fair Price For Health
Fair Value US$16.12|26.0% undervalued
NV
Community Contributor
TMX Group will thrive with 33.3% profit margin and enduring market moat
Fair Value CA$49.90|3.7% overvalued
LI
Community Contributor