
Advertisement
- United Kingdom
- /
- Metals and Mining
- /
- LSE:FXPO
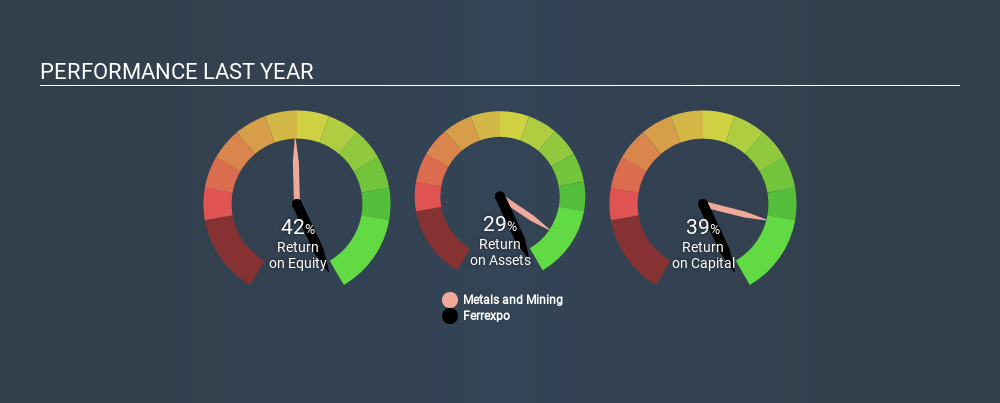
Why We Like Ferrexpo Plc’s (LON:FXPO) 39% Return On Capital Employed

Today we'll evaluate Ferrexpo Plc (LON:FXPO) to determine whether it could have potential as an investment idea. Specifically, we're going to calculate its Return On Capital Employed (ROCE), in the hopes of getting some insight into the business.
First, we'll go over how we calculate ROCE. Second, we'll look at its ROCE compared to similar companies. And finally, we'll look at how its current liabilities are impacting its ROCE.
What is Return On Capital Employed (ROCE)?
ROCE is a measure of a company's yearly pre-tax profit (its return), relative to the capital employed in the business. In general, businesses with a higher ROCE are usually better quality. Overall, it is a valuable metric that has its flaws. Renowned investment researcher Michael Mauboussin has suggested that a high ROCE can indicate that 'one dollar invested in the company generates value of more than one dollar'.
How Do You Calculate Return On Capital Employed?
The formula for calculating the return on capital employed is:
Return on Capital Employed = Earnings Before Interest and Tax (EBIT) ÷ (Total Assets - Current Liabilities)
Or for Ferrexpo:
0.39 = US$560m ÷ (US$1.7b - US$227m) (Based on the trailing twelve months to June 2019.)
Therefore, Ferrexpo has an ROCE of 39%.
View our latest analysis for Ferrexpo
Is Ferrexpo's ROCE Good?
When making comparisons between similar businesses, investors may find ROCE useful. In our analysis, Ferrexpo's ROCE is meaningfully higher than the 13% average in the Metals and Mining industry. We consider this a positive sign, because it suggests it uses capital more efficiently than similar companies. Regardless of the industry comparison, in absolute terms, Ferrexpo's ROCE currently appears to be excellent.
Our data shows that Ferrexpo currently has an ROCE of 39%, compared to its ROCE of 25% 3 years ago. This makes us think about whether the company has been reinvesting shrewdly. The image below shows how Ferrexpo's ROCE compares to its industry.
Remember that this metric is backwards looking - it shows what has happened in the past, and does not accurately predict the future. ROCE can be misleading for companies in cyclical industries, with returns looking impressive during the boom times, but very weak during the busts. ROCE is, after all, simply a snap shot of a single year. Remember that most companies like Ferrexpo are cyclical businesses. Future performance is what matters, and you can see analyst predictions in our free report on analyst forecasts for the company.
How Ferrexpo's Current Liabilities Impact Its ROCE
Liabilities, such as supplier bills and bank overdrafts, are referred to as current liabilities if they need to be paid within 12 months. The ROCE equation subtracts current liabilities from capital employed, so a company with a lot of current liabilities appears to have less capital employed, and a higher ROCE than otherwise. To check the impact of this, we calculate if a company has high current liabilities relative to its total assets.
Ferrexpo has total assets of US$1.7b and current liabilities of US$227m. As a result, its current liabilities are equal to approximately 14% of its total assets. This is quite a low level of current liabilities which would not greatly boost the already high ROCE.
Our Take On Ferrexpo's ROCE
This is good to see, and with such a high ROCE, Ferrexpo may be worth a closer look. There might be better investments than Ferrexpo out there, but you will have to work hard to find them . These promising businesses with rapidly growing earnings might be right up your alley.
I will like Ferrexpo better if I see some big insider buys. While we wait, check out this free list of growing companies with considerable, recent, insider buying.
If you spot an error that warrants correction, please contact the editor at editorial-team@simplywallst.com. This article by Simply Wall St is general in nature. It does not constitute a recommendation to buy or sell any stock, and does not take account of your objectives, or your financial situation. Simply Wall St has no position in the stocks mentioned.
We aim to bring you long-term focused research analysis driven by fundamental data. Note that our analysis may not factor in the latest price-sensitive company announcements or qualitative material. Thank you for reading.
About LSE:FXPO
Ferrexpo
Ferrexpo plc, together with its subsidiaries, mines for, develops, processes, produces, markets, exports, and sells iron ore pellets to the metallurgical industry.
Very undervalued with flawless balance sheet.
Similar Companies
Market Insights


Advertisement
Community Narratives
The Future of Drug Testing? Fingerprint Tech Shows Serious Promise
Fair Value US$2.98|40.3% undervalued
JO
Community Contributor
Suncorp’s Next Chapter: Insurance-Only and Ready to Grow
Fair Value AU$22.83|7.9% undervalued
RO
Community Contributor
Thyssenkrupp Nucera Will Achieve Double-Digit Profits by 2030 Boosted by Hydrogen Growth
Fair Value €14.40|31.6% undervalued
CH
Community Contributor
Tesla’s Nvidia Moment – The AI & Robotics Inflection Point
Fair Value US$359.72|12.3% undervalued
BL
Community Contributor