
Advertisement
- United Kingdom
- /
- Metals and Mining
- /
- AIM:SHG
Is Shanta Gold Limited (LON:SHG) Better Than Average At Deploying Capital?

Today we'll look at Shanta Gold Limited (LON:SHG) and reflect on its potential as an investment. Specifically, we're going to calculate its Return On Capital Employed (ROCE), in the hopes of getting some insight into the business.
Firstly, we'll go over how we calculate ROCE. Second, we'll look at its ROCE compared to similar companies. Finally, we'll look at how its current liabilities affect its ROCE.
Understanding Return On Capital Employed (ROCE)
ROCE is a metric for evaluating how much pre-tax income (in percentage terms) a company earns on the capital invested in its business. All else being equal, a better business will have a higher ROCE. In brief, it is a useful tool, but it is not without drawbacks. Renowned investment researcher Michael Mauboussin has suggested that a high ROCE can indicate that 'one dollar invested in the company generates value of more than one dollar'.
So, How Do We Calculate ROCE?
The formula for calculating the return on capital employed is:
Return on Capital Employed = Earnings Before Interest and Tax (EBIT) ÷ (Total Assets - Current Liabilities)
Or for Shanta Gold:
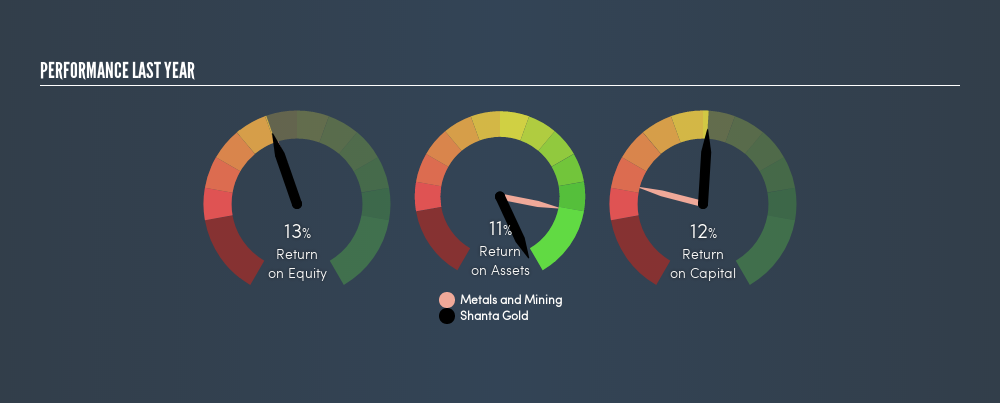
0.12 = US$10m ÷ (US$184m - US$36m) (Based on the trailing twelve months to June 2018.)
Therefore, Shanta Gold has an ROCE of 12%.
See our latest analysis for Shanta Gold
Is Shanta Gold's ROCE Good?
One way to assess ROCE is to compare similar companies. Using our data, Shanta Gold's ROCE appears to be around the 13% average of the Metals and Mining industry. Independently of how Shanta Gold compares to its industry, its ROCE in absolute terms appears decent, and the company may be worthy of closer investigation.
In our analysis, Shanta Gold's ROCE appears to be 12%, compared to 3 years ago, when its ROCE was 2.9%. This makes us wonder if the company is improving.
When considering ROCE, bear in mind that it reflects the past and does not necessarily predict the future. Companies in cyclical industries can be difficult to understand using ROCE, as returns typically look high during boom times, and low during busts. This is because ROCE only looks at one year, instead of considering returns across a whole cycle. We note Shanta Gold could be considered a cyclical business. What happens in the future is pretty important for investors, so we have prepared a freereport on analyst forecasts for Shanta Gold.
Do Shanta Gold's Current Liabilities Skew Its ROCE?
Liabilities, such as supplier bills and bank overdrafts, are referred to as current liabilities if they need to be paid within 12 months. Due to the way the ROCE equation works, having large bills due in the near term can make it look as though a company has less capital employed, and thus a higher ROCE than usual. To counter this, investors can check if a company has high current liabilities relative to total assets.
Shanta Gold has total assets of US$184m and current liabilities of US$36m. Therefore its current liabilities are equivalent to approximately 19% of its total assets. Low current liabilities are not boosting the ROCE too much.
Our Take On Shanta Gold's ROCE
Overall, Shanta Gold has a decent ROCE and could be worthy of further research. You might be able to find a better buy than Shanta Gold. If you want a selection of possible winners, check out this freelist of interesting companies that trade on a P/E below 20 (but have proven they can grow earnings).
I will like Shanta Gold better if I see some big insider buys. While we wait, check out this freelist of growing companies with considerable, recent, insider buying.
We aim to bring you long-term focused research analysis driven by fundamental data. Note that our analysis may not factor in the latest price-sensitive company announcements or qualitative material.
If you spot an error that warrants correction, please contact the editor at editorial-team@simplywallst.com. This article by Simply Wall St is general in nature. It does not constitute a recommendation to buy or sell any stock, and does not take account of your objectives, or your financial situation. Simply Wall St has no position in the stocks mentioned. Thank you for reading.
About AIM:SHG
Shanta Gold
Shanta Gold Limited, together with its subsidiaries, engages in the exploration, development, and production of gold in East Africa.
Flawless balance sheet with acceptable track record.
Similar Companies
Market Insights


Advertisement
Community Narratives
The Future of Drug Testing? Fingerprint Tech Shows Serious Promise
Fair Value US$2.98|40.3% undervalued
JO
Community Contributor
Suncorp’s Next Chapter: Insurance-Only and Ready to Grow
Fair Value AU$22.83|7.9% undervalued
RO
Community Contributor
Thyssenkrupp Nucera Will Achieve Double-Digit Profits by 2030 Boosted by Hydrogen Growth
Fair Value €14.40|31.6% undervalued
CH
Community Contributor
Tesla’s Nvidia Moment – The AI & Robotics Inflection Point
Fair Value US$359.72|12.3% undervalued
BL
Community Contributor