
Advertisement

Today we'll evaluate Scapa Group plc (LON:SCPA) to determine whether it could have potential as an investment idea. Specifically, we're going to calculate its Return On Capital Employed (ROCE), in the hopes of getting some insight into the business.
Firstly, we'll go over how we calculate ROCE. Second, we'll look at its ROCE compared to similar companies. Finally, we'll look at how its current liabilities affect its ROCE.
Understanding Return On Capital Employed (ROCE)
ROCE measures the amount of pre-tax profits a company can generate from the capital employed in its business. Generally speaking a higher ROCE is better. Overall, it is a valuable metric that has its flaws. Author Edwin Whiting says to be careful when comparing the ROCE of different businesses, since 'No two businesses are exactly alike.
How Do You Calculate Return On Capital Employed?
Analysts use this formula to calculate return on capital employed:
Return on Capital Employed = Earnings Before Interest and Tax (EBIT) ÷ (Total Assets - Current Liabilities)
Or for Scapa Group:
0.10 = UK£26m ÷ (UK£334m - UK£85m) (Based on the trailing twelve months to September 2019.)
Therefore, Scapa Group has an ROCE of 10%.
View our latest analysis for Scapa Group
Does Scapa Group Have A Good ROCE?
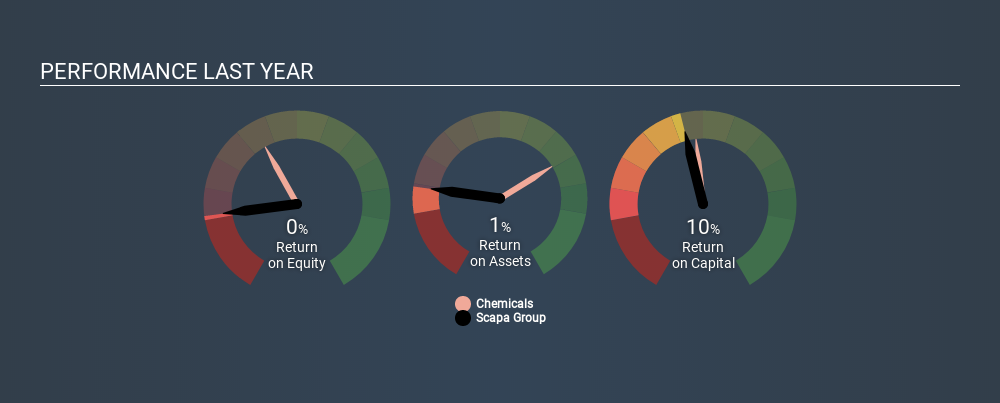
One way to assess ROCE is to compare similar companies. Using our data, Scapa Group's ROCE appears to be significantly below the 13% average in the Chemicals industry. This performance could be negative if sustained, as it suggests the business may underperform its industry. Regardless of where Scapa Group sits next to its industry, its ROCE in absolute terms appears satisfactory, and this company could be worth a closer look.
You can see in the image below how Scapa Group's ROCE compares to its industry. Click to see more on past growth.
When considering this metric, keep in mind that it is backwards looking, and not necessarily predictive. Companies in cyclical industries can be difficult to understand using ROCE, as returns typically look high during boom times, and low during busts. This is because ROCE only looks at one year, instead of considering returns across a whole cycle. Future performance is what matters, and you can see analyst predictions in our free report on analyst forecasts for the company.
How Scapa Group's Current Liabilities Impact Its ROCE
Current liabilities are short term bills and invoices that need to be paid in 12 months or less. Due to the way ROCE is calculated, a high level of current liabilities makes a company look as though it has less capital employed, and thus can (sometimes unfairly) boost the ROCE. To counteract this, we check if a company has high current liabilities, relative to its total assets.
Scapa Group has total liabilities of UK£85m and total assets of UK£334m. As a result, its current liabilities are equal to approximately 25% of its total assets. Current liabilities are minimal, limiting the impact on ROCE.
Our Take On Scapa Group's ROCE
Overall, Scapa Group has a decent ROCE and could be worthy of further research. There might be better investments than Scapa Group out there, but you will have to work hard to find them . These promising businesses with rapidly growing earnings might be right up your alley.
I will like Scapa Group better if I see some big insider buys. While we wait, check out this free list of growing companies with considerable, recent, insider buying.
If you spot an error that warrants correction, please contact the editor at editorial-team@simplywallst.com. This article by Simply Wall St is general in nature. It does not constitute a recommendation to buy or sell any stock, and does not take account of your objectives, or your financial situation. Simply Wall St has no position in the stocks mentioned.
We aim to bring you long-term focused research analysis driven by fundamental data. Note that our analysis may not factor in the latest price-sensitive company announcements or qualitative material. Thank you for reading.
Market Insights


Advertisement
Community Narratives
For the Emperor: Why Games Workshop Could Be a Star Investment
Fair Value UK£160.00|0.4% overvalued
RO
Community Contributor
Securitas will boost margins with AI and tech-driven services
Fair Value SEK 260.91|44.5% undervalued
UN
Community Contributor
A Leader in EV Charging with Growth Potential
Fair Value €27.00|17.8% undervalued
TI
Community Contributor