Stock Analysis


Many investors are still learning about the various metrics that can be useful when analysing a stock. This article is for those who would like to learn about Return On Equity (ROE). We'll use ROE to examine Admiral Group plc (LON:ADM), by way of a worked example.
Return on equity or ROE is an important factor to be considered by a shareholder because it tells them how effectively their capital is being reinvested. Simply put, it is used to assess the profitability of a company in relation to its equity capital.
See our latest analysis for Admiral Group
How Do You Calculate Return On Equity?
The formula for return on equity is:
Return on Equity = Net Profit (from continuing operations) ÷ Shareholders' Equity
So, based on the above formula, the ROE for Admiral Group is:
39% = UK£364m ÷ UK£929m (Based on the trailing twelve months to June 2023).
The 'return' is the profit over the last twelve months. One way to conceptualize this is that for each £1 of shareholders' capital it has, the company made £0.39 in profit.
Does Admiral Group Have A Good Return On Equity?
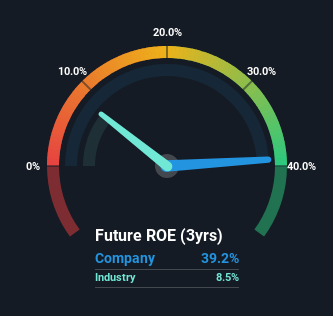
By comparing a company's ROE with its industry average, we can get a quick measure of how good it is. However, this method is only useful as a rough check, because companies do differ quite a bit within the same industry classification. As you can see in the graphic below, Admiral Group has a higher ROE than the average (8.5%) in the Insurance industry.
That is a good sign. However, bear in mind that a high ROE doesn’t necessarily indicate efficient profit generation. Aside from changes in net income, a high ROE can also be the outcome of high debt relative to equity, which indicates risk. You can see the 2 risks we have identified for Admiral Group by visiting our risks dashboard for free on our platform here.
How Does Debt Impact ROE?
Virtually all companies need money to invest in the business, to grow profits. That cash can come from retained earnings, issuing new shares (equity), or debt. In the case of the first and second options, the ROE will reflect this use of cash, for growth. In the latter case, the debt required for growth will boost returns, but will not impact the shareholders' equity. In this manner the use of debt will boost ROE, even though the core economics of the business stay the same.
Admiral Group's Debt And Its 39% ROE
Admiral Group does use a high amount of debt to increase returns. It has a debt to equity ratio of 1.28. There's no doubt the ROE is impressive, but it's worth keeping in mind that the metric could have been lower if the company were to reduce its debt. Debt increases risk and reduces options for the company in the future, so you generally want to see some good returns from using it.
Conclusion
Return on equity is useful for comparing the quality of different businesses. In our books, the highest quality companies have high return on equity, despite low debt. If two companies have the same ROE, then I would generally prefer the one with less debt.
But when a business is high quality, the market often bids it up to a price that reflects this. Profit growth rates, versus the expectations reflected in the price of the stock, are a particularly important to consider. So I think it may be worth checking this free report on analyst forecasts for the company.
Of course Admiral Group may not be the best stock to buy. So you may wish to see this free collection of other companies that have high ROE and low debt.
Valuation is complex, but we're helping make it simple.
Find out whether Admiral Group is potentially over or undervalued by checking out our comprehensive analysis, which includes fair value estimates, risks and warnings, dividends, insider transactions and financial health.
View the Free AnalysisHave feedback on this article? Concerned about the content? Get in touch with us directly. Alternatively, email editorial-team (at) simplywallst.com.
This article by Simply Wall St is general in nature. We provide commentary based on historical data and analyst forecasts only using an unbiased methodology and our articles are not intended to be financial advice. It does not constitute a recommendation to buy or sell any stock, and does not take account of your objectives, or your financial situation. We aim to bring you long-term focused analysis driven by fundamental data. Note that our analysis may not factor in the latest price-sensitive company announcements or qualitative material. Simply Wall St has no position in any stocks mentioned.
About LSE:ADM
Admiral Group
A financial services company, provides insurance and personal lending products in the United Kingdom, France, Italy, Spain, and the United States.
Reasonable growth potential with adequate balance sheet.
