
Advertisement
- United Kingdom
- /
- Medical Equipment
- /
- AIM:AMS
Advanced Medical Solutions Group plc (LON:AMS) Shares Could Be 38% Below Their Intrinsic Value Estimate

Key Insights
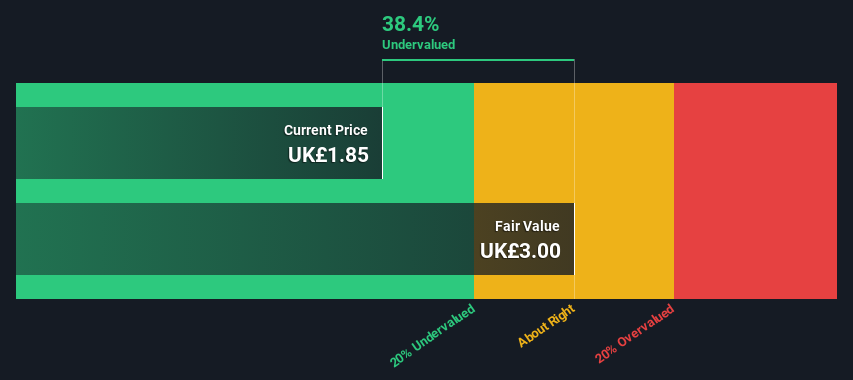
- Advanced Medical Solutions Group's estimated fair value is UK£3.00 based on 2 Stage Free Cash Flow to Equity
- Advanced Medical Solutions Group is estimated to be 38% undervalued based on current share price of UK£1.85
- Analyst price target for AMS is UK£2.73 which is 9.0% below our fair value estimate
Today we will run through one way of estimating the intrinsic value of Advanced Medical Solutions Group plc (LON:AMS) by estimating the company's future cash flows and discounting them to their present value. We will use the Discounted Cash Flow (DCF) model on this occasion. Before you think you won't be able to understand it, just read on! It's actually much less complex than you'd imagine.
Companies can be valued in a lot of ways, so we would point out that a DCF is not perfect for every situation. If you still have some burning questions about this type of valuation, take a look at the Simply Wall St analysis model.
See our latest analysis for Advanced Medical Solutions Group
What's The Estimated Valuation?
We use what is known as a 2-stage model, which simply means we have two different periods of growth rates for the company's cash flows. Generally the first stage is higher growth, and the second stage is a lower growth phase. To begin with, we have to get estimates of the next ten years of cash flows. Where possible we use analyst estimates, but when these aren't available we extrapolate the previous free cash flow (FCF) from the last estimate or reported value. We assume companies with shrinking free cash flow will slow their rate of shrinkage, and that companies with growing free cash flow will see their growth rate slow, over this period. We do this to reflect that growth tends to slow more in the early years than it does in later years.
Generally we assume that a dollar today is more valuable than a dollar in the future, and so the sum of these future cash flows is then discounted to today's value:
10-year free cash flow (FCF) forecast
| 2024 | 2025 | 2026 | 2027 | 2028 | 2029 | 2030 | 2031 | 2032 | 2033 | |
| Levered FCF (£, Millions) | UK£21.6m | UK£24.6m | UK£33.6m | UK£35.5m | UK£36.9m | UK£38.0m | UK£39.0m | UK£39.9m | UK£40.7m | UK£41.5m |
| Growth Rate Estimate Source | Analyst x5 | Analyst x5 | Analyst x1 | Analyst x1 | Est @ 3.92% | Est @ 3.16% | Est @ 2.62% | Est @ 2.25% | Est @ 1.99% | Est @ 1.81% |
| Present Value (£, Millions) Discounted @ 6.7% | UK£20.2 | UK£21.6 | UK£27.7 | UK£27.4 | UK£26.6 | UK£25.8 | UK£24.8 | UK£23.7 | UK£22.7 | UK£21.6 |
("Est" = FCF growth rate estimated by Simply Wall St)
Present Value of 10-year Cash Flow (PVCF) = UK£242m
The second stage is also known as Terminal Value, this is the business's cash flow after the first stage. The Gordon Growth formula is used to calculate Terminal Value at a future annual growth rate equal to the 5-year average of the 10-year government bond yield of 1.4%. We discount the terminal cash flows to today's value at a cost of equity of 6.7%.
Terminal Value (TV)= FCF2033 × (1 + g) ÷ (r – g) = UK£41m× (1 + 1.4%) ÷ (6.7%– 1.4%) = UK£787m
Present Value of Terminal Value (PVTV)= TV / (1 + r)10= UK£787m÷ ( 1 + 6.7%)10= UK£411m
The total value, or equity value, is then the sum of the present value of the future cash flows, which in this case is UK£653m. The last step is to then divide the equity value by the number of shares outstanding. Relative to the current share price of UK£1.9, the company appears quite undervalued at a 38% discount to where the stock price trades currently. Remember though, that this is just an approximate valuation, and like any complex formula - garbage in, garbage out.
The Assumptions
We would point out that the most important inputs to a discounted cash flow are the discount rate and of course the actual cash flows. If you don't agree with these result, have a go at the calculation yourself and play with the assumptions. The DCF also does not consider the possible cyclicality of an industry, or a company's future capital requirements, so it does not give a full picture of a company's potential performance. Given that we are looking at Advanced Medical Solutions Group as potential shareholders, the cost of equity is used as the discount rate, rather than the cost of capital (or weighted average cost of capital, WACC) which accounts for debt. In this calculation we've used 6.7%, which is based on a levered beta of 0.904. Beta is a measure of a stock's volatility, compared to the market as a whole. We get our beta from the industry average beta of globally comparable companies, with an imposed limit between 0.8 and 2.0, which is a reasonable range for a stable business.
SWOT Analysis for Advanced Medical Solutions Group
Strength
- Earnings growth over the past year exceeded the industry.
- Currently debt free.
Weakness
- Dividend is low compared to the top 25% of dividend payers in the Medical Equipment market.
Opportunity
- Annual revenue is forecast to grow faster than the British market.
- Good value based on P/E ratio and estimated fair value.
Threat
- Annual earnings are forecast to grow slower than the British market.
Looking Ahead:
Valuation is only one side of the coin in terms of building your investment thesis, and it is only one of many factors that you need to assess for a company. It's not possible to obtain a foolproof valuation with a DCF model. Instead the best use for a DCF model is to test certain assumptions and theories to see if they would lead to the company being undervalued or overvalued. For example, changes in the company's cost of equity or the risk free rate can significantly impact the valuation. Can we work out why the company is trading at a discount to intrinsic value? For Advanced Medical Solutions Group, we've put together three important factors you should further research:
- Risks: To that end, you should be aware of the 1 warning sign we've spotted with Advanced Medical Solutions Group .
- Future Earnings: How does AMS's growth rate compare to its peers and the wider market? Dig deeper into the analyst consensus number for the upcoming years by interacting with our free analyst growth expectation chart.
- Other Solid Businesses: Low debt, high returns on equity and good past performance are fundamental to a strong business. Why not explore our interactive list of stocks with solid business fundamentals to see if there are other companies you may not have considered!
PS. The Simply Wall St app conducts a discounted cash flow valuation for every stock on the AIM every day. If you want to find the calculation for other stocks just search here.
New: Manage All Your Stock Portfolios in One Place
We've created the ultimate portfolio companion for stock investors, and it's free.
• Connect an unlimited number of Portfolios and see your total in one currency
• Be alerted to new Warning Signs or Risks via email or mobile
• Track the Fair Value of your stocks
Have feedback on this article? Concerned about the content? Get in touch with us directly. Alternatively, email editorial-team (at) simplywallst.com.
This article by Simply Wall St is general in nature. We provide commentary based on historical data and analyst forecasts only using an unbiased methodology and our articles are not intended to be financial advice. It does not constitute a recommendation to buy or sell any stock, and does not take account of your objectives, or your financial situation. We aim to bring you long-term focused analysis driven by fundamental data. Note that our analysis may not factor in the latest price-sensitive company announcements or qualitative material. Simply Wall St has no position in any stocks mentioned.
About AIM:AMS
Advanced Medical Solutions Group
Develops, manufactures, and distributes products for the surgical, woundcare, and wound-closure markets in the United Kingdom, Germany, rest of Europe, the United States, and internationally.
Excellent balance sheet with reasonable growth potential and pays a dividend.
Similar Companies
Market Insights


Advertisement
Community Narratives
For the Emperor: Why Games Workshop Could Be a Star Investment
Fair Value UK£160.00|0.1% overvalued
RO
Community Contributor
Securitas will boost margins with AI and tech-driven services
Fair Value SEK 260.91|44.5% undervalued
UN
Community Contributor
A Leader in EV Charging with Growth Potential
Fair Value €27.00|20.9% undervalued
TI
Community Contributor