
Advertisement

This article is written for those who want to get better at using price to earnings ratios (P/E ratios). We'll look at Bakkavor Group plc's (LON:BAKK) P/E ratio and reflect on what it tells us about the company's share price. What is Bakkavor Group's P/E ratio? Well, based on the last twelve months it is 17.84. In other words, at today's prices, investors are paying £17.84 for every £1 in prior year profit.
Check out our latest analysis for Bakkavor Group
How Do I Calculate A Price To Earnings Ratio?
The formula for P/E is:
Price to Earnings Ratio = Share Price ÷ Earnings per Share (EPS)
Or for Bakkavor Group:
P/E of 17.84 = GBP1.35 ÷ GBP0.08 (Based on the year to June 2019.)
Is A High Price-to-Earnings Ratio Good?
The higher the P/E ratio, the higher the price tag of a business, relative to its trailing earnings. That is not a good or a bad thing per se, but a high P/E does imply buyers are optimistic about the future.
Does Bakkavor Group Have A Relatively High Or Low P/E For Its Industry?
The P/E ratio essentially measures market expectations of a company. You can see in the image below that the average P/E (16.6) for companies in the food industry is lower than Bakkavor Group's P/E.
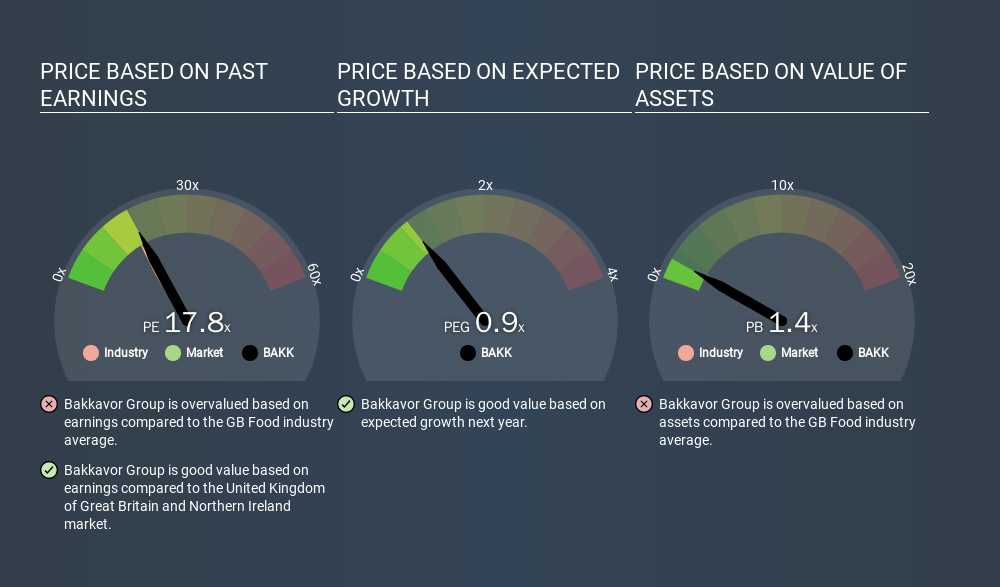
That means that the market expects Bakkavor Group will outperform other companies in its industry. Clearly the market expects growth, but it isn't guaranteed. So further research is always essential. I often monitor director buying and selling.
How Growth Rates Impact P/E Ratios
When earnings fall, the 'E' decreases, over time. Therefore, even if you pay a low multiple of earnings now, that multiple will become higher in the future. A higher P/E should indicate the stock is expensive relative to others -- and that may encourage shareholders to sell.
Bakkavor Group's earnings per share fell by 34% in the last twelve months. And EPS is down 1.1% a year, over the last 5 years. This growth rate might warrant a below average P/E ratio.
Don't Forget: The P/E Does Not Account For Debt or Bank Deposits
It's important to note that the P/E ratio considers the market capitalization, not the enterprise value. Thus, the metric does not reflect cash or debt held by the company. The exact same company would hypothetically deserve a higher P/E ratio if it had a strong balance sheet, than if it had a weak one with lots of debt, because a cashed up company can spend on growth.
Such expenditure might be good or bad, in the long term, but the point here is that the balance sheet is not reflected by this ratio.
So What Does Bakkavor Group's Balance Sheet Tell Us?
Net debt is 45% of Bakkavor Group's market cap. You'd want to be aware of this fact, but it doesn't bother us.
The Verdict On Bakkavor Group's P/E Ratio
Bakkavor Group has a P/E of 17.8. That's around the same as the average in the GB market, which is 18.3. With modest debt, and a lack of recent growth, it would seem the market is expecting improvement in earnings.
When the market is wrong about a stock, it gives savvy investors an opportunity. As value investor Benjamin Graham famously said, 'In the short run, the market is a voting machine but in the long run, it is a weighing machine. So this free visual report on analyst forecasts could hold the key to an excellent investment decision.
Of course, you might find a fantastic investment by looking at a few good candidates. So take a peek at this free list of companies with modest (or no) debt, trading on a P/E below 20.
If you spot an error that warrants correction, please contact the editor at editorial-team@simplywallst.com. This article by Simply Wall St is general in nature. It does not constitute a recommendation to buy or sell any stock, and does not take account of your objectives, or your financial situation. Simply Wall St has no position in the stocks mentioned.
We aim to bring you long-term focused research analysis driven by fundamental data. Note that our analysis may not factor in the latest price-sensitive company announcements or qualitative material. Thank you for reading.
About LSE:BAKK
Bakkavor Group
Engages in the preparation and marketing of fresh prepared foods in the United Kingdom, the United States, and China.
Adequate balance sheet second-rate dividend payer.
Similar Companies
Market Insights


Advertisement
Community Narratives
For the Emperor: Why Games Workshop Could Be a Star Investment
Fair Value UK£160.00|0.5% overvalued
RO
Community Contributor
Securitas will boost margins with AI and tech-driven services
Fair Value SEK 260.91|44.5% undervalued
UN
Community Contributor
A Leader in EV Charging with Growth Potential
Fair Value €27.00|18.7% undervalued
TI
Community Contributor