- United Kingdom
- /
- Oil and Gas
- /
- LSE:SEPL
The three-year decline in earnings for Seplat Energy LON:SEPL) isn't encouraging, but shareholders are still up 159% over that period


One simple way to benefit from the stock market is to buy an index fund. But if you choose individual stocks with prowess, you can make superior returns. For example, Seplat Energy Plc (LON:SEPL) shareholders have seen the share price rise 78% over three years, well in excess of the market return (19%, not including dividends).
While this past week has detracted from the company's three-year return, let's look at the recent trends of the underlying business and see if the gains have been in alignment.
Check out our latest analysis for Seplat Energy
SWOT Analysis for Seplat Energy
- Debt is not viewed as a risk.
- Dividends are covered by earnings and cash flows.
- Dividend is in the top 25% of dividend payers in the market.
- Earnings declined over the past year.
- Expensive based on P/E ratio and estimated fair value.
- SEPL's financial characteristics indicate limited near-term opportunities for shareholders.
- Annual earnings are forecast to decline for the next 2 years.
To quote Buffett, 'Ships will sail around the world but the Flat Earth Society will flourish. There will continue to be wide discrepancies between price and value in the marketplace...' One way to examine how market sentiment has changed over time is to look at the interaction between a company's share price and its earnings per share (EPS).
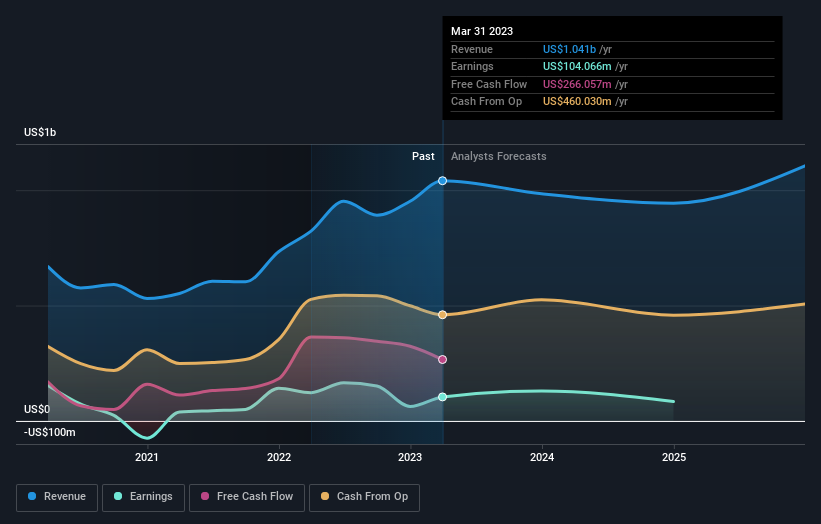
Over the last three years, Seplat Energy failed to grow earnings per share, which fell 13% (annualized).
This means it's unlikely the market is judging the company based on earnings growth. Therefore, we think it's worth considering other metrics as well.
The dividend is no better now than it was three years ago, so that is unlikely to have driven the share price higher. It's much more likely that the fact that Seplat Energy has been growing revenue at 22% a year is seen as a genuine positive. It could be that investors are content with the revenue growth on the basis that the company isn't really focussed on profits just yet. And that might explain the higher price.
The company's revenue and earnings (over time) are depicted in the image below (click to see the exact numbers).
You can see how its balance sheet has strengthened (or weakened) over time in this free interactive graphic.
What About Dividends?
As well as measuring the share price return, investors should also consider the total shareholder return (TSR). The TSR incorporates the value of any spin-offs or discounted capital raisings, along with any dividends, based on the assumption that the dividends are reinvested. So for companies that pay a generous dividend, the TSR is often a lot higher than the share price return. We note that for Seplat Energy the TSR over the last 3 years was 159%, which is better than the share price return mentioned above. The dividends paid by the company have thusly boosted the total shareholder return.
A Different Perspective
Investors in Seplat Energy had a tough year, with a total loss of 14% (including dividends), against a market gain of about 4.5%. However, keep in mind that even the best stocks will sometimes underperform the market over a twelve month period. Longer term investors wouldn't be so upset, since they would have made 1.8%, each year, over five years. It could be that the recent sell-off is an opportunity, so it may be worth checking the fundamental data for signs of a long term growth trend. It's always interesting to track share price performance over the longer term. But to understand Seplat Energy better, we need to consider many other factors. Case in point: We've spotted 3 warning signs for Seplat Energy you should be aware of, and 1 of them shouldn't be ignored.
Of course Seplat Energy may not be the best stock to buy. So you may wish to see this free collection of growth stocks.
Please note, the market returns quoted in this article reflect the market weighted average returns of stocks that currently trade on British exchanges.
New: Manage All Your Stock Portfolios in One Place
We've created the ultimate portfolio companion for stock investors, and it's free.
• Connect an unlimited number of Portfolios and see your total in one currency
• Be alerted to new Warning Signs or Risks via email or mobile
• Track the Fair Value of your stocks
Have feedback on this article? Concerned about the content? Get in touch with us directly. Alternatively, email editorial-team (at) simplywallst.com.
This article by Simply Wall St is general in nature. We provide commentary based on historical data and analyst forecasts only using an unbiased methodology and our articles are not intended to be financial advice. It does not constitute a recommendation to buy or sell any stock, and does not take account of your objectives, or your financial situation. We aim to bring you long-term focused analysis driven by fundamental data. Note that our analysis may not factor in the latest price-sensitive company announcements or qualitative material. Simply Wall St has no position in any stocks mentioned.
About LSE:SEPL
Seplat Energy
An independent energy company, engages in the oil and gas exploration and production, and gas processing activities in Nigeria, Bahamas, Italy, Switzerland, England, and Singapore.
Solid track record established dividend payer.
Similar Companies
Market Insights

Community Narratives

