Stock Analysis
- United Kingdom
- /
- Oil and Gas
- /
- LSE:BP.
Is BP p.l.c.'s (LON:BP.) Stock's Recent Performance Being Led By Its Attractive Financial Prospects?

BP's (LON:BP.) stock is up by a considerable 8.5% over the past month. Since the market usually pay for a company’s long-term fundamentals, we decided to study the company’s key performance indicators to see if they could be influencing the market. Specifically, we decided to study BP's ROE in this article.
Return on equity or ROE is a key measure used to assess how efficiently a company's management is utilizing the company's capital. In simpler terms, it measures the profitability of a company in relation to shareholder's equity.
View our latest analysis for BP
How To Calculate Return On Equity?
ROE can be calculated by using the formula:
Return on Equity = Net Profit (from continuing operations) ÷ Shareholders' Equity
So, based on the above formula, the ROE for BP is:
19% = US$16b ÷ US$85b (Based on the trailing twelve months to December 2023).
The 'return' refers to a company's earnings over the last year. Another way to think of that is that for every £1 worth of equity, the company was able to earn £0.19 in profit.
What Has ROE Got To Do With Earnings Growth?
We have already established that ROE serves as an efficient profit-generating gauge for a company's future earnings. We now need to evaluate how much profit the company reinvests or "retains" for future growth which then gives us an idea about the growth potential of the company. Generally speaking, other things being equal, firms with a high return on equity and profit retention, have a higher growth rate than firms that don’t share these attributes.
BP's Earnings Growth And 19% ROE
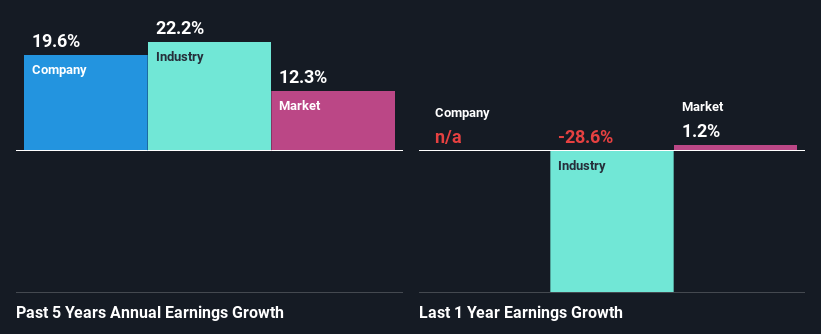
To begin with, BP seems to have a respectable ROE. And on comparing with the industry, we found that the the average industry ROE is similar at 16%. Consequently, this likely laid the ground for the decent growth of 20% seen over the past five years by BP.
Next, on comparing BP's net income growth with the industry, we found that the company's reported growth is similar to the industry average growth rate of 22% over the last few years.
The basis for attaching value to a company is, to a great extent, tied to its earnings growth. What investors need to determine next is if the expected earnings growth, or the lack of it, is already built into the share price. By doing so, they will have an idea if the stock is headed into clear blue waters or if swampy waters await. What is BP. worth today? The intrinsic value infographic in our free research report helps visualize whether BP. is currently mispriced by the market.
Is BP Efficiently Re-investing Its Profits?
BP's three-year median payout ratio to shareholders is 18% (implying that it retains 82% of its income), which is on the lower side, so it seems like the management is reinvesting profits heavily to grow its business.
Additionally, BP has paid dividends over a period of at least ten years which means that the company is pretty serious about sharing its profits with shareholders. Our latest analyst data shows that the future payout ratio of the company is expected to rise to 35% over the next three years. Regardless, the ROE is not expected to change much for the company despite the higher expected payout ratio.
Summary
In total, we are pretty happy with BP's performance. Particularly, we like that the company is reinvesting heavily into its business, and at a high rate of return. Unsurprisingly, this has led to an impressive earnings growth. That being so, according to the latest industry analyst forecasts, the company's earnings are expected to shrink in the future. To know more about the company's future earnings growth forecasts take a look at this free report on analyst forecasts for the company to find out more.
Valuation is complex, but we're helping make it simple.
Find out whether BP is potentially over or undervalued by checking out our comprehensive analysis, which includes fair value estimates, risks and warnings, dividends, insider transactions and financial health.
View the Free AnalysisHave feedback on this article? Concerned about the content? Get in touch with us directly. Alternatively, email editorial-team (at) simplywallst.com.
This article by Simply Wall St is general in nature. We provide commentary based on historical data and analyst forecasts only using an unbiased methodology and our articles are not intended to be financial advice. It does not constitute a recommendation to buy or sell any stock, and does not take account of your objectives, or your financial situation. We aim to bring you long-term focused analysis driven by fundamental data. Note that our analysis may not factor in the latest price-sensitive company announcements or qualitative material. Simply Wall St has no position in any stocks mentioned.
About LSE:BP.
Undervalued with excellent balance sheet.

