Stock Analysis
- United Kingdom
- /
- Software
- /
- LSE:SGE
Investors in Sage Group (LON:SGE) have seen notable returns of 94% over the past three years


One simple way to benefit from the stock market is to buy an index fund. But if you choose individual stocks with prowess, you can make superior returns. Just take a look at The Sage Group plc (LON:SGE), which is up 81%, over three years, soundly beating the market return of 1.4% (not including dividends). On the other hand, the returns haven't been quite so good recently, with shareholders up just 46% , including dividends .
With that in mind, it's worth seeing if the company's underlying fundamentals have been the driver of long term performance, or if there are some discrepancies.
Check out our latest analysis for Sage Group
To paraphrase Benjamin Graham: Over the short term the market is a voting machine, but over the long term it's a weighing machine. By comparing earnings per share (EPS) and share price changes over time, we can get a feel for how investor attitudes to a company have morphed over time.
During the three years of share price growth, Sage Group actually saw its earnings per share (EPS) drop 9.5% per year.
Thus, it seems unlikely that the market is focussed on EPS growth at the moment. Given this situation, it makes sense to look at other metrics too.
Languishing at just 1.7%, we doubt the dividend is doing much to prop up the share price. It could be that the revenue growth of 5.3% per year is viewed as evidence that Sage Group is growing. In that case, the company may be sacrificing current earnings per share to drive growth, and maybe shareholder's faith in better days ahead will be rewarded.
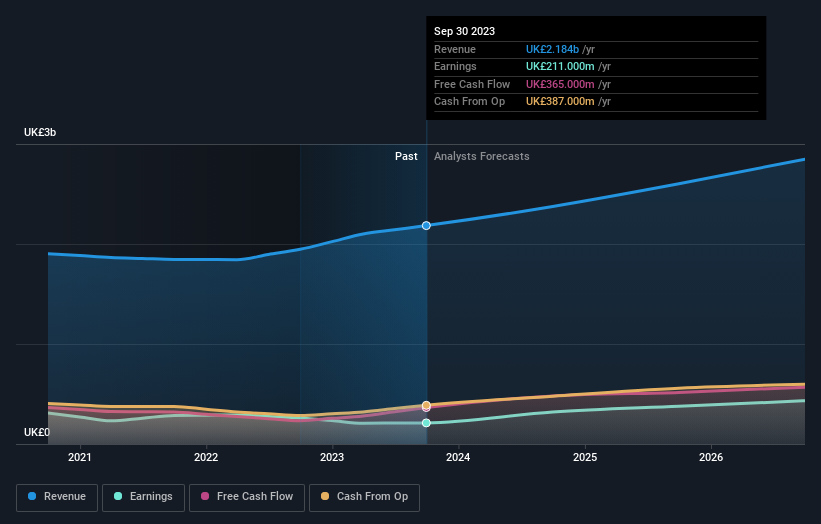
The image below shows how earnings and revenue have tracked over time (if you click on the image you can see greater detail).
We like that insiders have been buying shares in the last twelve months. Even so, future earnings will be far more important to whether current shareholders make money. So we recommend checking out this free report showing consensus forecasts
What About Dividends?
When looking at investment returns, it is important to consider the difference between total shareholder return (TSR) and share price return. The TSR incorporates the value of any spin-offs or discounted capital raisings, along with any dividends, based on the assumption that the dividends are reinvested. So for companies that pay a generous dividend, the TSR is often a lot higher than the share price return. We note that for Sage Group the TSR over the last 3 years was 94%, which is better than the share price return mentioned above. This is largely a result of its dividend payments!
A Different Perspective
It's good to see that Sage Group has rewarded shareholders with a total shareholder return of 46% in the last twelve months. That's including the dividend. That gain is better than the annual TSR over five years, which is 13%. Therefore it seems like sentiment around the company has been positive lately. Given the share price momentum remains strong, it might be worth taking a closer look at the stock, lest you miss an opportunity. It's always interesting to track share price performance over the longer term. But to understand Sage Group better, we need to consider many other factors. Even so, be aware that Sage Group is showing 1 warning sign in our investment analysis , you should know about...
Sage Group is not the only stock that insiders are buying. For those who like to find winning investments this free list of growing companies with recent insider purchasing, could be just the ticket.
Please note, the market returns quoted in this article reflect the market weighted average returns of stocks that currently trade on British exchanges.
Valuation is complex, but we're helping make it simple.
Find out whether Sage Group is potentially over or undervalued by checking out our comprehensive analysis, which includes fair value estimates, risks and warnings, dividends, insider transactions and financial health.
View the Free AnalysisHave feedback on this article? Concerned about the content? Get in touch with us directly. Alternatively, email editorial-team (at) simplywallst.com.
This article by Simply Wall St is general in nature. We provide commentary based on historical data and analyst forecasts only using an unbiased methodology and our articles are not intended to be financial advice. It does not constitute a recommendation to buy or sell any stock, and does not take account of your objectives, or your financial situation. We aim to bring you long-term focused analysis driven by fundamental data. Note that our analysis may not factor in the latest price-sensitive company announcements or qualitative material. Simply Wall St has no position in any stocks mentioned.
About LSE:SGE
Sage Group
The Sage Group plc, together with its subsidiaries, provides technology solutions and services for small and medium businesses in the United States, the United Kingdom, France, and internationally.
Reasonable growth potential with mediocre balance sheet.
