
Advertisement
- United Kingdom
- /
- Oil and Gas
- /
- AIM:JOG
Here's Why We're Watching Jersey Oil and Gas' (LON:JOG) Cash Burn Situation
Just because a business does not make any money, does not mean that the stock will go down. For example, although software-as-a-service business Salesforce.com lost money for years while it grew recurring revenue, if you held shares since 2005, you'd have done very well indeed. Having said that, unprofitable companies are risky because they could potentially burn through all their cash and become distressed.
So, the natural question for Jersey Oil and Gas (LON:JOG) shareholders is whether they should be concerned by its rate of cash burn. In this article, we define cash burn as its annual (negative) free cash flow, which is the amount of money a company spends each year to fund its growth. Let's start with an examination of the business' cash, relative to its cash burn.
View our latest analysis for Jersey Oil and Gas
How Long Is Jersey Oil and Gas' Cash Runway?
You can calculate a company's cash runway by dividing the amount of cash it has by the rate at which it is spending that cash. In June 2022, Jersey Oil and Gas had UK£8.7m in cash, and was debt-free. Looking at the last year, the company burnt through UK£8.2m. That means it had a cash runway of around 13 months as of June 2022. While that cash runway isn't too concerning, sensible holders would be peering into the distance, and considering what happens if the company runs out of cash. Importantly, if we extrapolate recent cash burn trends, the cash runway would be noticeably longer. The image below shows how its cash balance has been changing over the last few years.
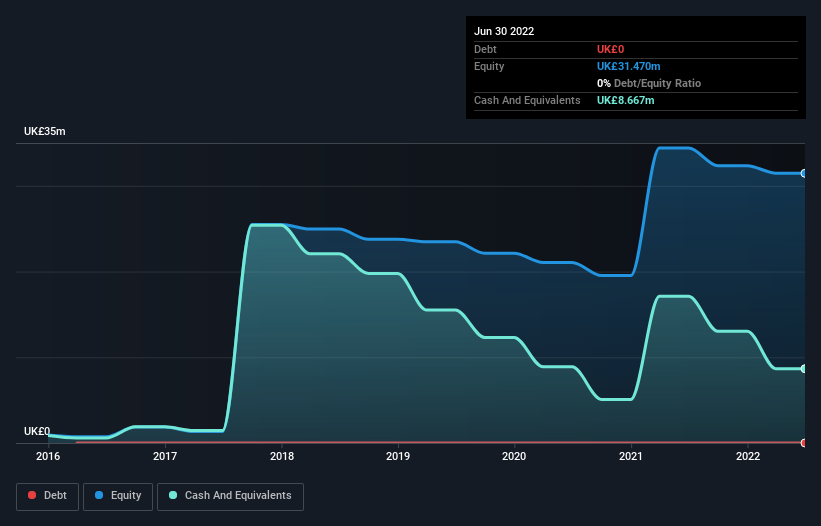
How Is Jersey Oil and Gas' Cash Burn Changing Over Time?
Because Jersey Oil and Gas isn't currently generating revenue, we consider it an early-stage business. Nonetheless, we can still examine its cash burn trajectory as part of our assessment of its cash burn situation. Cash burn was pretty flat over the last year, which suggests that management are holding spending steady while the business advances its strategy. Clearly, however, the crucial factor is whether the company will grow its business going forward. For that reason, it makes a lot of sense to take a look at our analyst forecasts for the company.
How Hard Would It Be For Jersey Oil and Gas To Raise More Cash For Growth?
Even though it has reduced its cash burn recently, shareholders should still consider how easy it would be for Jersey Oil and Gas to raise more cash in the future. Generally speaking, a listed business can raise new cash through issuing shares or taking on debt. Many companies end up issuing new shares to fund future growth. By comparing a company's annual cash burn to its total market capitalisation, we can estimate roughly how many shares it would have to issue in order to run the company for another year (at the same burn rate).
Since it has a market capitalisation of UK£84m, Jersey Oil and Gas' UK£8.2m in cash burn equates to about 9.8% of its market value. That's a low proportion, so we figure the company would be able to raise more cash to fund growth, with a little dilution, or even to simply borrow some money.
Is Jersey Oil and Gas' Cash Burn A Worry?
Jersey Oil and Gas appears to be in pretty good health when it comes to its cash burn situation. One the one hand we have its solid cash runway, while on the other it can also boast very strong cash burn relative to its market cap. We don't think its cash burn is particularly problematic, but after considering the range of factors in this article, we do think shareholders should be monitoring how it changes over time. On another note, we conducted an in-depth investigation of the company, and identified 3 warning signs for Jersey Oil and Gas (1 makes us a bit uncomfortable!) that you should be aware of before investing here.
Of course, you might find a fantastic investment by looking elsewhere. So take a peek at this free list of companies insiders are buying, and this list of stocks growth stocks (according to analyst forecasts)
New: Manage All Your Stock Portfolios in One Place
We've created the ultimate portfolio companion for stock investors, and it's free.
• Connect an unlimited number of Portfolios and see your total in one currency
• Be alerted to new Warning Signs or Risks via email or mobile
• Track the Fair Value of your stocks
Have feedback on this article? Concerned about the content? Get in touch with us directly. Alternatively, email editorial-team (at) simplywallst.com.
This article by Simply Wall St is general in nature. We provide commentary based on historical data and analyst forecasts only using an unbiased methodology and our articles are not intended to be financial advice. It does not constitute a recommendation to buy or sell any stock, and does not take account of your objectives, or your financial situation. We aim to bring you long-term focused analysis driven by fundamental data. Note that our analysis may not factor in the latest price-sensitive company announcements or qualitative material. Simply Wall St has no position in any stocks mentioned.
About AIM:JOG
Jersey Oil and Gas
Engages in the exploration, appraisal, development, and production of oil and gas properties in the North Sea of the United Kingdom.
Excellent balance sheet with slight risk.
Similar Companies
Market Insights

Advertisement
Community Narratives
MicroVision will explode future revenue by 380.37% with a vision towards success
Fair Value US$60|98.4% undervalued
TH
Community Contributor
The Indispensable Artery for a New North American Economy
Fair Value CA$132.87|0.8% undervalued
TI
Community Contributor
Recently Updated Narratives
RE

RecMag on Proximus ·
Proximus: The State-Backed Backup Plan with 7% Gross Yield and 15% Currency Upside.
Fair Value:€17.1356.7% undervalued
29 followersusers have followed this narrative
0 commentsusers have commented on this narrative
0 likesusers have liked this narrative
SW

swift11 on DXC Technology ·
CEO: We are winners in the long term in the AI world
Fair Value:US$17.4624.9% undervalued
1 followerusers have followed this narrative
0 commentsusers have commented on this narrative
0 likesusers have liked this narrative
AL

AlexLovell on Rocket Lab ·
Early mover in a fast growing industry. Likely to experience share price volatility as they scale
Fair Value:US$16.25158.0% overvalued
2 followersusers have followed this narrative
0 commentsusers have commented on this narrative
0 likesusers have liked this narrative
Popular Narratives
TH

TheWallstreetKing on MicroVision ·
MicroVision will explode future revenue by 380.37% with a vision towards success
Fair Value:US$6098.4% undervalued
101 followersusers have followed this narrative
10 commentsusers have commented on this narrative
20 likesusers have liked this narrative
OS


oscargarcia on Alphabet ·
The company that turned a verb into a global necessity and basically runs the modern internet, digital ads, smartphones, maps, and AI.
Fair Value:US$3405.9% undervalued
137 followersusers have followed this narrative
6 commentsusers have commented on this narrative
18 likesusers have liked this narrative
AN


AnalystConsensusTarget on NVIDIA ·
NVDA: Expanding AI Demand Will Drive Major Data Center Investments Through 2026
Fair Value:US$232.7922.6% undervalued
929 followersusers have followed this narrative
6 commentsusers have commented on this narrative
22 likesusers have liked this narrative