
Advertisement
- United Kingdom
- /
- Capital Markets
- /
- LSE:TCAP
TP ICAP Group's (LON:TCAP) three-year total shareholder returns outpace the underlying earnings growth
It hasn't been the best quarter for TP ICAP Group PLC (LON:TCAP) shareholders, since the share price has fallen 12% in that time. But we wouldn't complain about the gain over the last three years. It beat the market return of 46% in that time, gaining 47%.
Although TP ICAP Group has shed UK£104m from its market cap this week, let's take a look at its longer term fundamental trends and see if they've driven returns.
While markets are a powerful pricing mechanism, share prices reflect investor sentiment, not just underlying business performance. One way to examine how market sentiment has changed over time is to look at the interaction between a company's share price and its earnings per share (EPS).
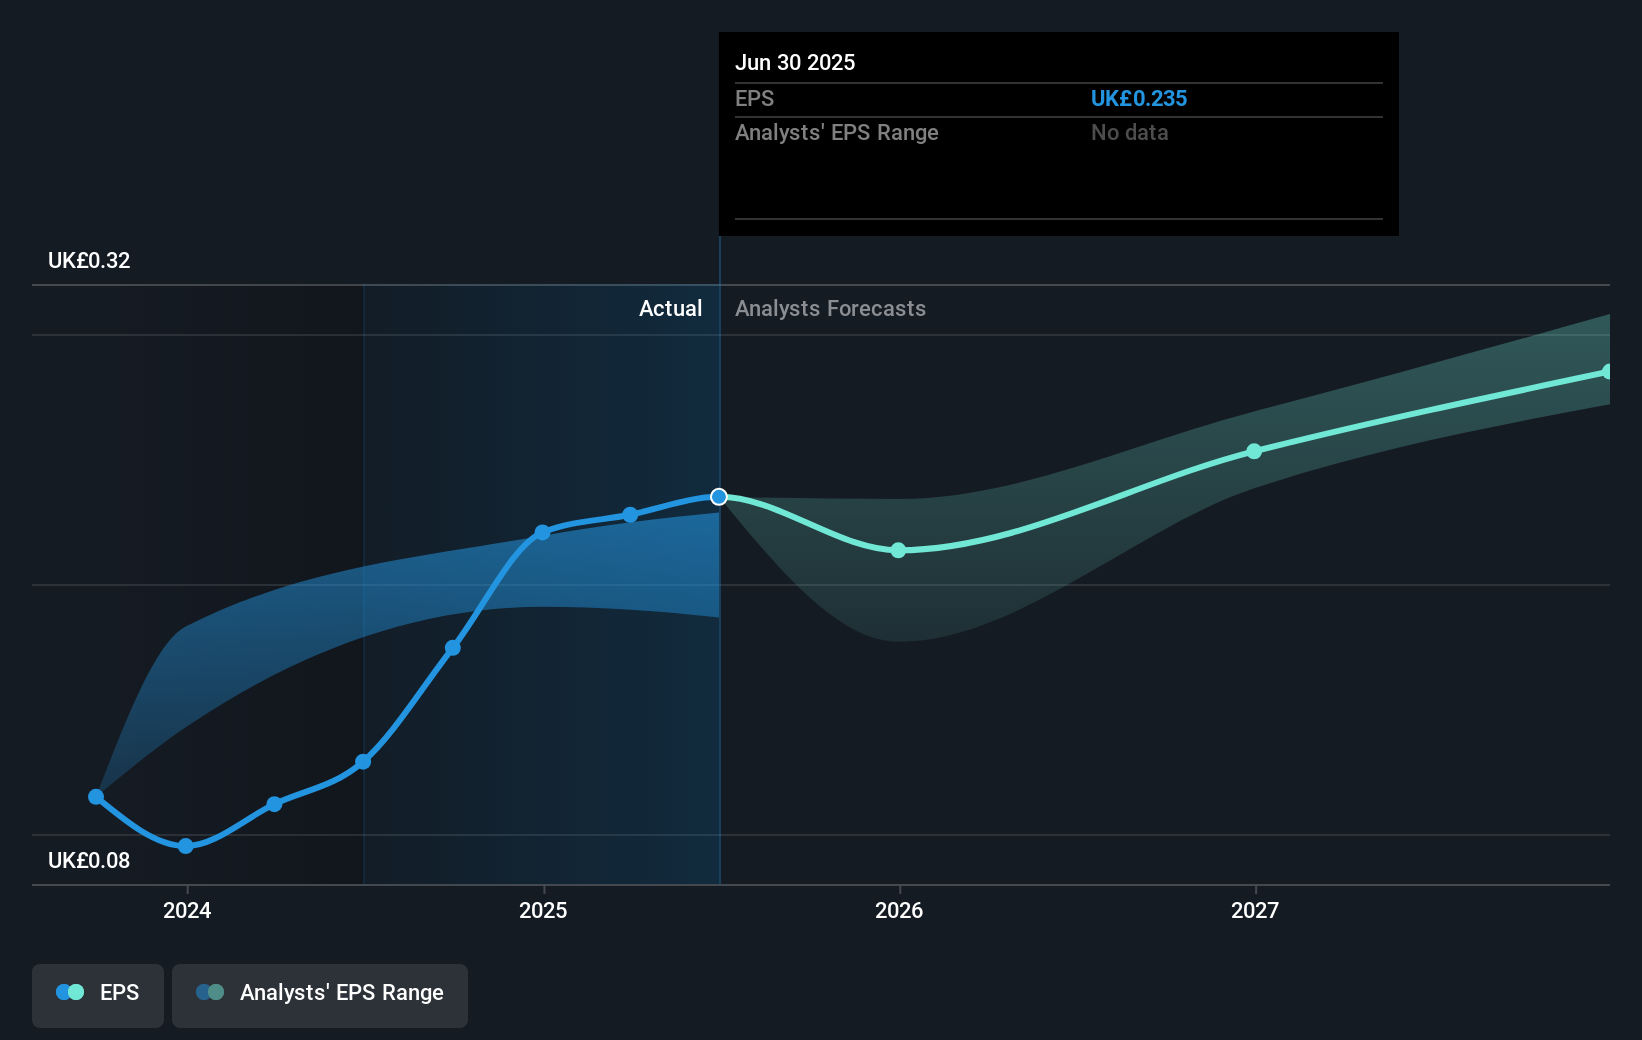
During three years of share price growth, TP ICAP Group achieved compound earnings per share growth of 39% per year. The average annual share price increase of 14% is actually lower than the EPS growth. Therefore, it seems the market has moderated its expectations for growth, somewhat. We'd venture the lowish P/E ratio of 10.68 also reflects the negative sentiment around the stock.
You can see below how EPS has changed over time (discover the exact values by clicking on the image).
It is of course excellent to see how TP ICAP Group has grown profits over the years, but the future is more important for shareholders. If you are thinking of buying or selling TP ICAP Group stock, you should check out this FREE detailed report on its balance sheet.
What About Dividends?
As well as measuring the share price return, investors should also consider the total shareholder return (TSR). Whereas the share price return only reflects the change in the share price, the TSR includes the value of dividends (assuming they were reinvested) and the benefit of any discounted capital raising or spin-off. It's fair to say that the TSR gives a more complete picture for stocks that pay a dividend. As it happens, TP ICAP Group's TSR for the last 3 years was 81%, which exceeds the share price return mentioned earlier. The dividends paid by the company have thusly boosted the total shareholder return.
A Different Perspective
TP ICAP Group provided a TSR of 9.2% over the last twelve months. But that return falls short of the market. If we look back over five years, the returns are even better, coming in at 13% per year for five years. It's quite possible the business continues to execute with prowess, even as the share price gains are slowing. It's always interesting to track share price performance over the longer term. But to understand TP ICAP Group better, we need to consider many other factors. Consider risks, for instance. Every company has them, and we've spotted 2 warning signs for TP ICAP Group you should know about.
We will like TP ICAP Group better if we see some big insider buys. While we wait, check out this free list of undervalued stocks (mostly small caps) with considerable, recent, insider buying.
Please note, the market returns quoted in this article reflect the market weighted average returns of stocks that currently trade on British exchanges.
Valuation is complex, but we're here to simplify it.
Discover if TP ICAP Group might be undervalued or overvalued with our detailed analysis, featuring fair value estimates, potential risks, dividends, insider trades, and its financial condition.
Access Free AnalysisHave feedback on this article? Concerned about the content? Get in touch with us directly. Alternatively, email editorial-team (at) simplywallst.com.
This article by Simply Wall St is general in nature. We provide commentary based on historical data and analyst forecasts only using an unbiased methodology and our articles are not intended to be financial advice. It does not constitute a recommendation to buy or sell any stock, and does not take account of your objectives, or your financial situation. We aim to bring you long-term focused analysis driven by fundamental data. Note that our analysis may not factor in the latest price-sensitive company announcements or qualitative material. Simply Wall St has no position in any stocks mentioned.
About LSE:TCAP
TP ICAP Group
Provides intermediary services, contextual insights, trade execution, pre-trade and settlement services, and data-led solutions in Europe, the Middle East, Africa, the Americas, and the Asia Pacific.
Good value with proven track record and pays a dividend.
Similar Companies
Market Insights

Advertisement
Community Narratives
The company that turned a verb into a global necessity and basically runs the modern internet, digital ads, smartphones, maps, and AI.
Fair Value US$300.00|5.2% undervalued
OS
Community Contributor
Flowers Foods Pays A Fair Price For Health
Fair Value US$16.12|24.9% undervalued
NV
Community Contributor
TMX Group will thrive with 33.3% profit margin and enduring market moat
Fair Value CA$49.90|3.3% overvalued
LI
Community Contributor
The "Molecular Pencil": Why Beam's Technology is Built to Win
Fair Value US$65.01|64.5% undervalued
DA
Community Contributor