Stock Analysis
- United Kingdom
- /
- Diversified Financial
- /
- LSE:PAY
The five-year loss for PayPoint (LON:PAY) shareholders likely driven by its shrinking earnings


While not a mind-blowing move, it is good to see that the PayPoint plc (LON:PAY) share price has gained 17% in the last three months. But if you look at the last five years the returns have not been good. After all, the share price is down 45% in that time, significantly under-performing the market.
Although the past week has been more reassuring for shareholders, they're still in the red over the last five years, so let's see if the underlying business has been responsible for the decline.
View our latest analysis for PayPoint
In his essay The Superinvestors of Graham-and-Doddsville Warren Buffett described how share prices do not always rationally reflect the value of a business. By comparing earnings per share (EPS) and share price changes over time, we can get a feel for how investor attitudes to a company have morphed over time.
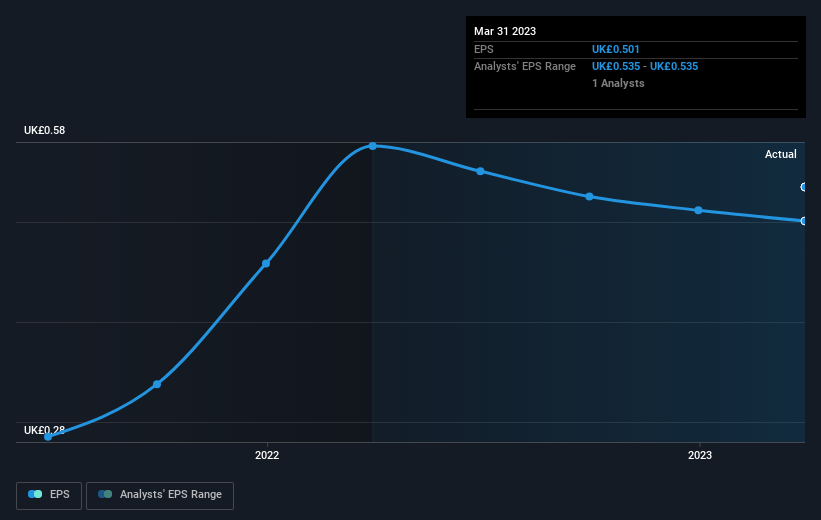
Looking back five years, both PayPoint's share price and EPS declined; the latter at a rate of 5.2% per year. This reduction in EPS is less than the 11% annual reduction in the share price. This implies that the market is more cautious about the business these days. The less favorable sentiment is reflected in its current P/E ratio of 10.63.
The image below shows how EPS has tracked over time (if you click on the image you can see greater detail).
We like that insiders have been buying shares in the last twelve months. Even so, future earnings will be far more important to whether current shareholders make money. It might be well worthwhile taking a look at our free report on PayPoint's earnings, revenue and cash flow.
What About Dividends?
As well as measuring the share price return, investors should also consider the total shareholder return (TSR). The TSR incorporates the value of any spin-offs or discounted capital raisings, along with any dividends, based on the assumption that the dividends are reinvested. It's fair to say that the TSR gives a more complete picture for stocks that pay a dividend. We note that for PayPoint the TSR over the last 5 years was -26%, which is better than the share price return mentioned above. The dividends paid by the company have thusly boosted the total shareholder return.
A Different Perspective
While the broader market gained around 3.3% in the last year, PayPoint shareholders lost 10% (even including dividends). However, keep in mind that even the best stocks will sometimes underperform the market over a twelve month period. Regrettably, last year's performance caps off a bad run, with the shareholders facing a total loss of 5% per year over five years. Generally speaking long term share price weakness can be a bad sign, though contrarian investors might want to research the stock in hope of a turnaround. I find it very interesting to look at share price over the long term as a proxy for business performance. But to truly gain insight, we need to consider other information, too. Case in point: We've spotted 4 warning signs for PayPoint you should be aware of, and 1 of them is concerning.
There are plenty of other companies that have insiders buying up shares. You probably do not want to miss this free list of growing companies that insiders are buying.
Please note, the market returns quoted in this article reflect the market weighted average returns of stocks that currently trade on British exchanges.
Valuation is complex, but we're helping make it simple.
Find out whether PayPoint is potentially over or undervalued by checking out our comprehensive analysis, which includes fair value estimates, risks and warnings, dividends, insider transactions and financial health.
View the Free AnalysisHave feedback on this article? Concerned about the content? Get in touch with us directly. Alternatively, email editorial-team (at) simplywallst.com.
This article by Simply Wall St is general in nature. We provide commentary based on historical data and analyst forecasts only using an unbiased methodology and our articles are not intended to be financial advice. It does not constitute a recommendation to buy or sell any stock, and does not take account of your objectives, or your financial situation. We aim to bring you long-term focused analysis driven by fundamental data. Note that our analysis may not factor in the latest price-sensitive company announcements or qualitative material. Simply Wall St has no position in any stocks mentioned.
About LSE:PAY
PayPoint
Engages in the provision of payments and banking, shopping, and e-commerce services and products in the United Kingdom.
Established dividend payer with proven track record.
