Stock Analysis
- United Kingdom
- /
- Diversified Financial
- /
- LSE:OSB
City of London Investment Group And Two More UK Dividend Stocks

Reviewed by Simply Wall St

Recent trends in the UK market, particularly the FTSE 100's downturn influenced by weak trade data from China, highlight a challenging global economic environment. In such times, identifying resilient dividend stocks becomes crucial for investors seeking stable returns amidst volatility.
Top 10 Dividend Stocks In The United Kingdom
| Name | Dividend Yield | Dividend Rating |
| James Latham (AIM:LTHM) | 5.81% | ★★★★★★ |
| Impax Asset Management Group (AIM:IPX) | 6.82% | ★★★★★☆ |
| Big Yellow Group (LSE:BYG) | 3.75% | ★★★★★☆ |
| Keller Group (LSE:KLR) | 3.05% | ★★★★★☆ |
| Rio Tinto Group (LSE:RIO) | 6.65% | ★★★★★☆ |
| Plus500 (LSE:PLUS) | 5.81% | ★★★★★☆ |
| Dunelm Group (LSE:DNLM) | 6.46% | ★★★★★☆ |
| Hargreaves Services (AIM:HSP) | 6.43% | ★★★★★☆ |
| NWF Group (AIM:NWF) | 4.50% | ★★★★★☆ |
| Grafton Group (LSE:GFTU) | 3.53% | ★★★★★☆ |
Click here to see the full list of 55 stocks from our Top UK Dividend Stocks screener.
Let's take a closer look at a couple of our picks from the screened companies.
City of London Investment Group (LSE:CLIG)
Simply Wall St Dividend Rating: ★★★★☆☆
Overview: City of London Investment Group PLC is a publicly owned investment manager with a market capitalization of approximately £186.76 million.
Operations: City of London Investment Group PLC generates its revenue primarily from asset management, contributing $73.72 million.
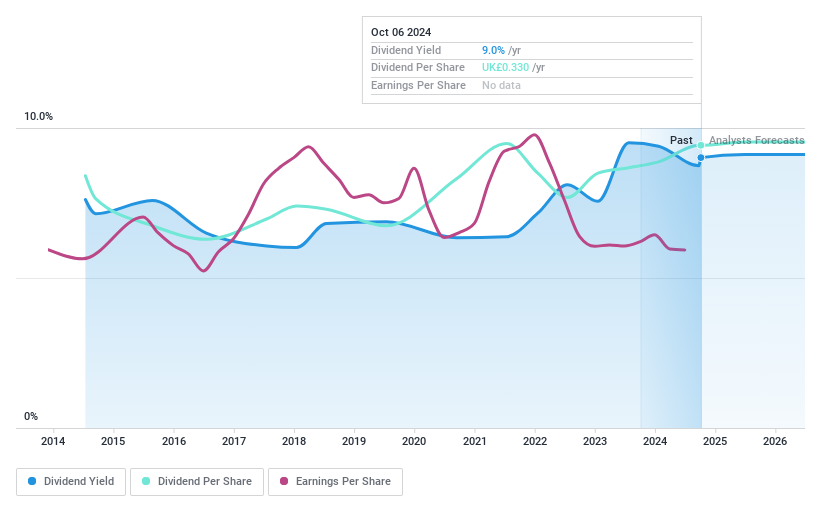
Dividend Yield: 8.3%
City of London Investment Group offers a high dividend yield at 8.27%, ranking in the top 25% in the UK market. However, its dividend sustainability is questionable with a payout ratio of 112.5% and dividends not well covered by earnings or free cash flow (89.6%). Despite trading below fair value, CLIG's dividends have shown volatility and unreliability over the past decade, although there has been an increase in dividend payments during this period.
- Unlock comprehensive insights into our analysis of City of London Investment Group stock in this dividend report.
- The analysis detailed in our City of London Investment Group valuation report hints at an deflated share price compared to its estimated value.
OSB Group (LSE:OSB)
Simply Wall St Dividend Rating: ★★★★☆☆
Overview: OSB Group Plc is a UK-based company specializing in mortgage lending and retail savings, with a market capitalization of approximately £1.90 billion.
Operations: OSB Group Plc generates its revenue primarily through its subsidiaries, Onesavings Bank Plc and Charter Court Financial Services Group Plc, which contributed £429.10 million and £230.20 million respectively.
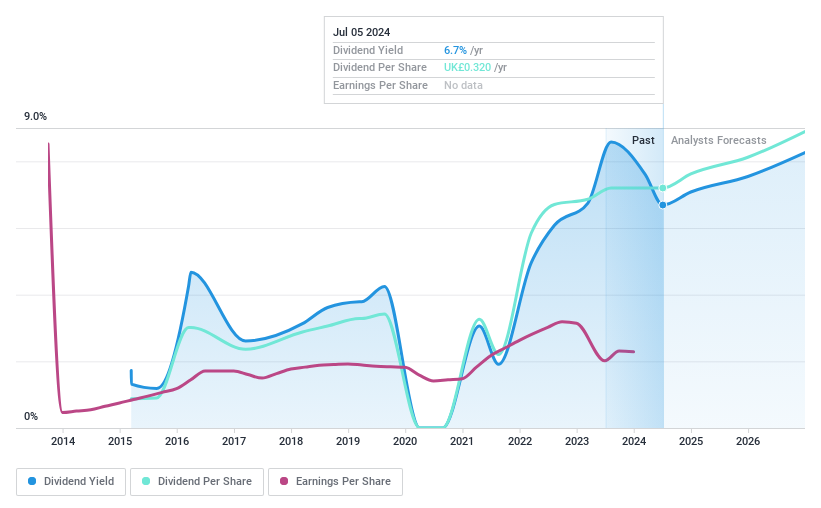
Dividend Yield: 6.6%
OSB Group's dividend sustainability is currently supported by a 48.4% payout ratio, though this is expected to decrease to 34.6% in three years, indicating potential future coverage challenges. The company has a history of volatile dividends over its less than 10-year dividend payment history and an unreliable track record over the past nine years. Additionally, OSB faces issues with a high bad loans ratio at 3%, hinting at financial instability that could impact future payouts.
- Dive into the specifics of OSB Group here with our thorough dividend report.
- According our valuation report, there's an indication that OSB Group's share price might be on the cheaper side.
Plus500 (LSE:PLUS)
Simply Wall St Dividend Rating: ★★★★★☆
Overview: Plus500 Ltd. is a fintech company that operates technology-based trading platforms across Europe, the United Kingdom, Australia, and other international markets, with a market capitalization of approximately £1.71 billion.
Operations: Plus500 Ltd. generates its revenue primarily through CFD trading, which amounted to $719.10 million.
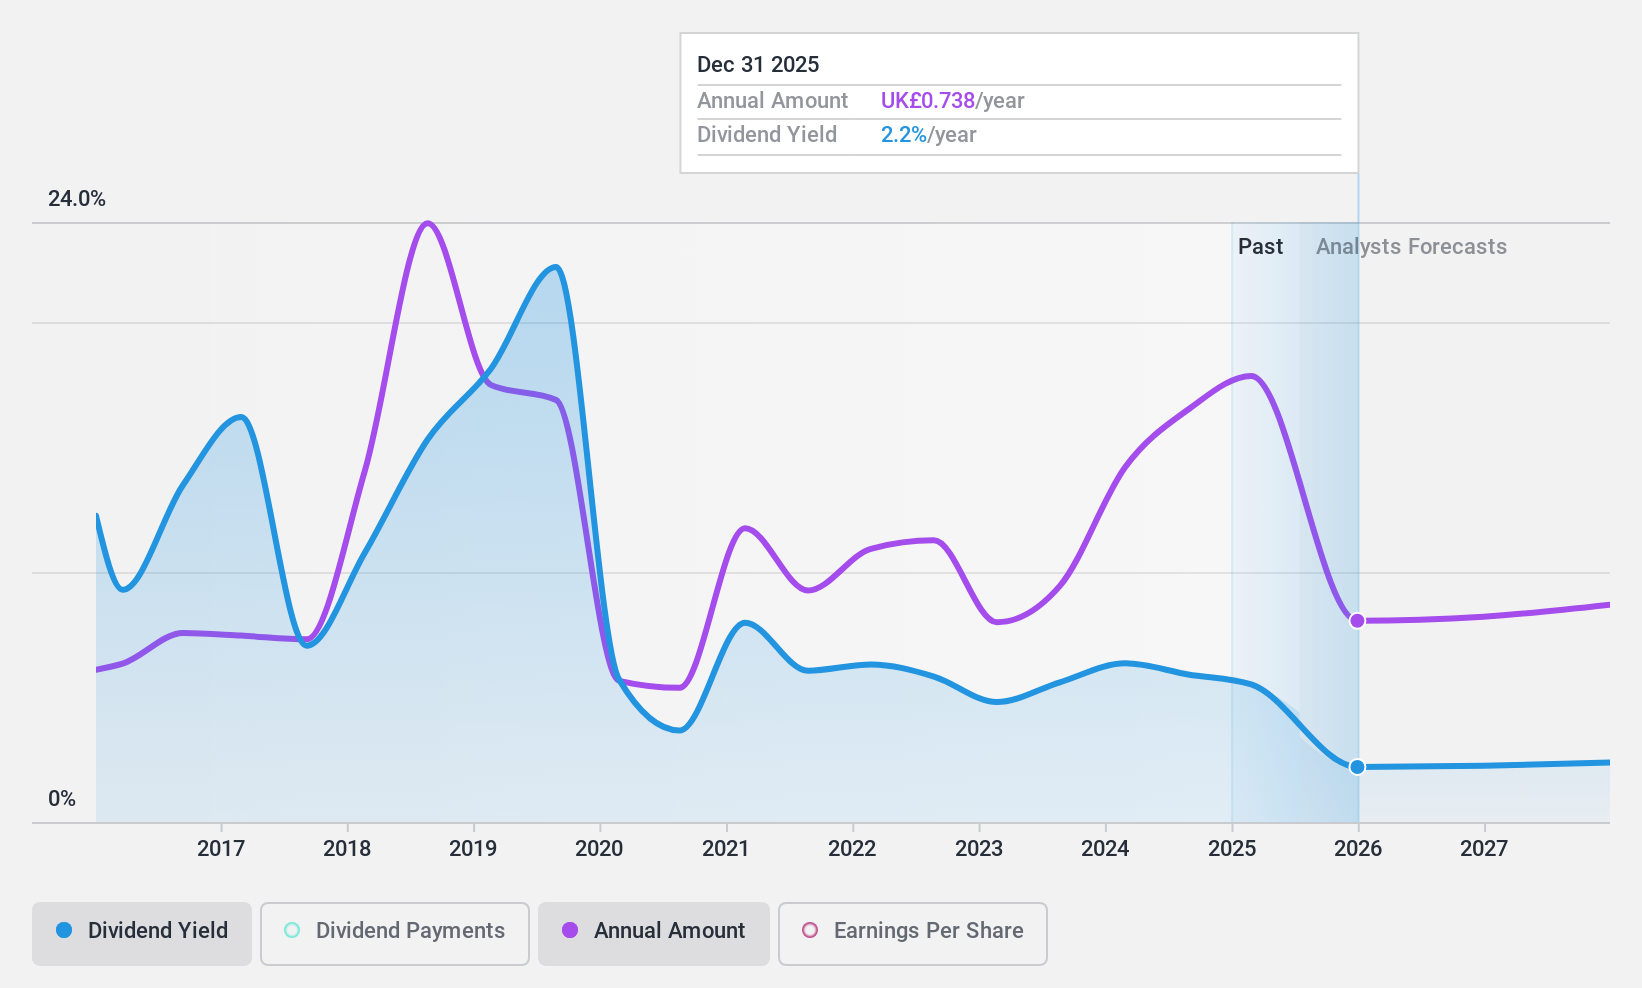
Dividend Yield: 5.8%
Plus500 offers a dividend yield of £5.81%, ranking in the top 25% of UK dividend payers, which is appealing despite its unstable history over the last decade. Trading at 59.8% below estimated fair value and with dividends well-covered by earnings (25.4% payout ratio) and cash flows (37.5% cash payout ratio), the financials suggest sustainability, although forecasted average earnings decline of 1% annually for three years could pressure future payouts.
- Click here and access our complete dividend analysis report to understand the dynamics of Plus500.
- Our comprehensive valuation report raises the possibility that Plus500 is priced lower than what may be justified by its financials.
Next Steps
- Unlock more gems! Our Top UK Dividend Stocks screener has unearthed 52 more companies for you to explore.Click here to unveil our expertly curated list of 55 Top UK Dividend Stocks.
- Invested in any of these stocks? Simplify your portfolio management with Simply Wall St and stay ahead with our alerts for any critical updates on your stocks.
- Maximize your investment potential with Simply Wall St, the comprehensive app that offers global market insights for free.
Contemplating Other Strategies?
- Explore high-performing small cap companies that haven't yet garnered significant analyst attention.
- Fuel your portfolio with companies showing strong growth potential, backed by optimistic outlooks both from analysts and management.
- Find companies with promising cash flow potential yet trading below their fair value.
This article by Simply Wall St is general in nature. We provide commentary based on historical data and analyst forecasts only using an unbiased methodology and our articles are not intended to be financial advice. It does not constitute a recommendation to buy or sell any stock, and does not take account of your objectives, or your financial situation. We aim to bring you long-term focused analysis driven by fundamental data. Note that our analysis may not factor in the latest price-sensitive company announcements or qualitative material. Simply Wall St has no position in any stocks mentioned.
Valuation is complex, but we're helping make it simple.
Find out whether OSB Group is potentially over or undervalued by checking out our comprehensive analysis, which includes fair value estimates, risks and warnings, dividends, insider transactions and financial health.
View the Free AnalysisHave feedback on this article? Concerned about the content? Get in touch with us directly. Alternatively, email editorial-team@simplywallst.com
About LSE:OSB
OSB Group
Through its subsidiaries, operates as a specialist mortgage lending and retail savings company in the United Kingdom and the Channel Islands.
Very undervalued with adequate balance sheet and pays a dividend.
