
Advertisement
- United Kingdom
- /
- Diversified Financial
- /
- AIM:TRU
TruFin plc's (LON:TRU) Shares Leap 29% Yet They're Still Not Telling The Full Story
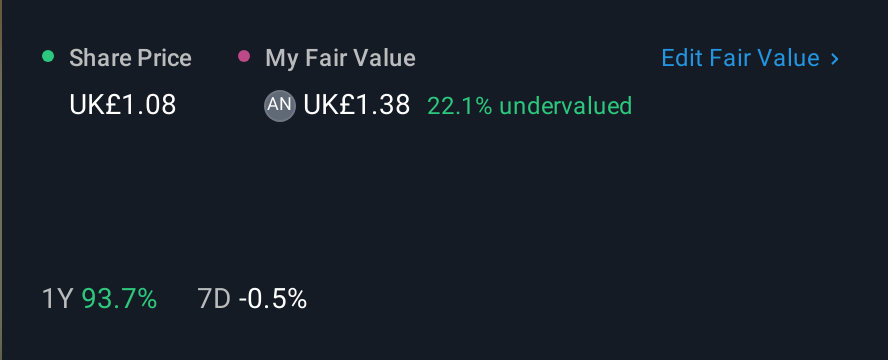
TruFin plc (LON:TRU) shares have continued their recent momentum with a 29% gain in the last month alone. The annual gain comes to 142% following the latest surge, making investors sit up and take notice.
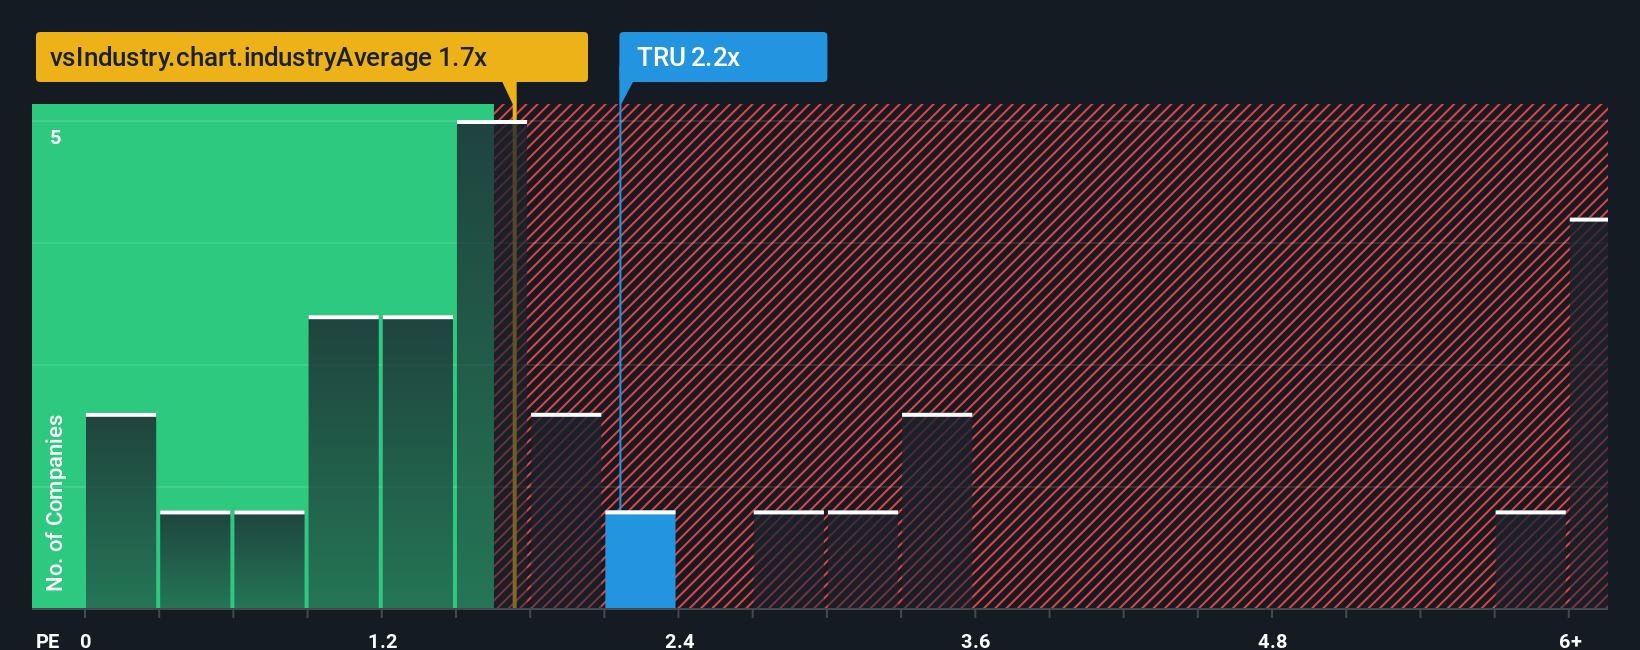
Even after such a large jump in price, there still wouldn't be many who think TruFin's price-to-sales (or "P/S") ratio of 2.2x is worth a mention when the median P/S in the United Kingdom's Diversified Financial industry is similar at about 1.7x. However, investors might be overlooking a clear opportunity or potential setback if there is no rational basis for the P/S.
Check out our latest analysis for TruFin
How Has TruFin Performed Recently?
Recent times have been advantageous for TruFin as its revenues have been rising faster than most other companies. One possibility is that the P/S ratio is moderate because investors think this strong revenue performance might be about to tail off. If not, then existing shareholders have reason to be feeling optimistic about the future direction of the share price.
If you'd like to see what analysts are forecasting going forward, you should check out our free report on TruFin.Is There Some Revenue Growth Forecasted For TruFin?
There's an inherent assumption that a company should be matching the industry for P/S ratios like TruFin's to be considered reasonable.
Taking a look back first, we see that the company grew revenue by an impressive 203% last year. Spectacularly, three year revenue growth has ballooned by several orders of magnitude, thanks in part to the last 12 months of revenue growth. So we can start by confirming that the company has done a tremendous job of growing revenue over that time.
Shifting to the future, estimates from the one analyst covering the company suggest revenue growth will show minor resilience over the next year growing only by 0.1%. Meanwhile, the broader industry is forecast to contract by 18%, which would indicate the company is doing better than the majority of its peers.
Despite the marginal growth, we find it odd that TruFin is trading at a fairly similar P/S to the industry. It looks like most investors aren't convinced the company can achieve positive future growth in the face of a shrinking broader industry.
What Does TruFin's P/S Mean For Investors?
TruFin's stock has a lot of momentum behind it lately, which has brought its P/S level with the rest of the industry. Typically, we'd caution against reading too much into price-to-sales ratios when settling on investment decisions, though it can reveal plenty about what other market participants think about the company.
Our examination of TruFin's analyst forecasts revealed that its superior revenue outlook against a shaky industry isn't resulting in the company trading at a higher P/S, as per our expectations. Given the glowing revenue forecasts, we can only assume potential risks are what might be capping the P/S ratio at its current levels. One such risk is that the company may not live up to analysts' revenue trajectories in tough industry conditions. It appears some are indeed anticipating revenue instability, because the company's current prospects should normally provide a boost to the share price.
The company's balance sheet is another key area for risk analysis. You can assess many of the main risks through our free balance sheet analysis for TruFin with six simple checks.
It's important to make sure you look for a great company, not just the first idea you come across. So if growing profitability aligns with your idea of a great company, take a peek at this free list of interesting companies with strong recent earnings growth (and a low P/E).
Valuation is complex, but we're here to simplify it.
Discover if TruFin might be undervalued or overvalued with our detailed analysis, featuring fair value estimates, potential risks, dividends, insider trades, and its financial condition.
Access Free AnalysisHave feedback on this article? Concerned about the content? Get in touch with us directly. Alternatively, email editorial-team (at) simplywallst.com.
This article by Simply Wall St is general in nature. We provide commentary based on historical data and analyst forecasts only using an unbiased methodology and our articles are not intended to be financial advice. It does not constitute a recommendation to buy or sell any stock, and does not take account of your objectives, or your financial situation. We aim to bring you long-term focused analysis driven by fundamental data. Note that our analysis may not factor in the latest price-sensitive company announcements or qualitative material. Simply Wall St has no position in any stocks mentioned.
About AIM:TRU
TruFin
Provides niche lending, early payment services, and video game publishing in the United Kingdom.
Solid track record with excellent balance sheet.
Market Insights

Advertisement
Community Narratives
The company that turned a verb into a global necessity and basically runs the modern internet, digital ads, smartphones, maps, and AI.
Fair Value US$300.00|10.2% undervalued
OS
Community Contributor
Flowers Foods Pays A Fair Price For Health
Fair Value US$16.12|20.3% undervalued
NV
Community Contributor
TMX Group will thrive with 33.3% profit margin and enduring market moat
Fair Value CA$49.90|0.1% undervalued
LI
Community Contributor