
Advertisement
If we want to find a potential multi-bagger, often there are underlying trends that can provide clues. In a perfect world, we'd like to see a company investing more capital into its business and ideally the returns earned from that capital are also increasing. This shows us that it's a compounding machine, able to continually reinvest its earnings back into the business and generate higher returns. So on that note, Trainline (LON:TRN) looks quite promising in regards to its trends of return on capital.
Understanding Return On Capital Employed (ROCE)
For those that aren't sure what ROCE is, it measures the amount of pre-tax profits a company can generate from the capital employed in its business. The formula for this calculation on Trainline is:
Return on Capital Employed = Earnings Before Interest and Tax (EBIT) ÷ (Total Assets - Current Liabilities)
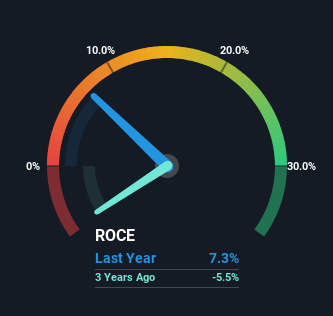
0.073 = UK£34m ÷ (UK£706m - UK£243m) (Based on the trailing twelve months to August 2023).
Thus, Trainline has an ROCE of 7.3%. Even though it's in line with the industry average of 7.3%, it's still a low return by itself.
See our latest analysis for Trainline
In the above chart we have measured Trainline's prior ROCE against its prior performance, but the future is arguably more important. If you'd like to see what analysts are forecasting going forward, you should check out our free analyst report for Trainline .
What Does the ROCE Trend For Trainline Tell Us?
Trainline is showing promise given that its ROCE is trending up and to the right. More specifically, while the company has kept capital employed relatively flat over the last five years, the ROCE has climbed 1,317% in that same time. Basically the business is generating higher returns from the same amount of capital and that is proof that there are improvements in the company's efficiencies. On that front, things are looking good so it's worth exploring what management has said about growth plans going forward.
On a side note, we noticed that the improvement in ROCE appears to be partly fueled by an increase in current liabilities. The current liabilities has increased to 34% of total assets, so the business is now more funded by the likes of its suppliers or short-term creditors. Keep an eye out for future increases because when the ratio of current liabilities to total assets gets particularly high, this can introduce some new risks for the business.
What We Can Learn From Trainline's ROCE
To sum it up, Trainline is collecting higher returns from the same amount of capital, and that's impressive. And since the stock has fallen 23% over the last three years, there might be an opportunity here. That being the case, research into the company's current valuation metrics and future prospects seems fitting.
While Trainline looks impressive, no company is worth an infinite price. The intrinsic value infographic for TRN helps visualize whether it is currently trading for a fair price.
For those who like to invest in solid companies, check out this free list of companies with solid balance sheets and high returns on equity.
Valuation is complex, but we're here to simplify it.
Discover if Trainline might be undervalued or overvalued with our detailed analysis, featuring fair value estimates, potential risks, dividends, insider trades, and its financial condition.
Access Free AnalysisHave feedback on this article? Concerned about the content? Get in touch with us directly. Alternatively, email editorial-team (at) simplywallst.com.
This article by Simply Wall St is general in nature. We provide commentary based on historical data and analyst forecasts only using an unbiased methodology and our articles are not intended to be financial advice. It does not constitute a recommendation to buy or sell any stock, and does not take account of your objectives, or your financial situation. We aim to bring you long-term focused analysis driven by fundamental data. Note that our analysis may not factor in the latest price-sensitive company announcements or qualitative material. Simply Wall St has no position in any stocks mentioned.
About LSE:TRN
Trainline
Engages in the operation of an independent rail and coach travel platform that sells rail and coach tickets worldwide.
Undervalued with solid track record.
Market Insights

Advertisement
Community Narratives
MicroVision will explode future revenue by 380.37% with a vision towards success
Fair Value US$60.00|98.4% undervalued
TH
Community Contributor
The Indispensable Artery for a New North American Economy
Fair Value CA$132.87|1.3% undervalued
TI
Community Contributor